Stocks didn’t reach a record high on Tuesday, but they came close. And, the S&P 500’s 0.88% rally was enough to leave the index at a record-high close of 2,933.68.

Twitter (NYSE:TWTR) was a key driver of that move, up nearly 16% following a first-quarter report that included a better-than-expected number of daily active users. Defense contractor Lockheed Martin (NYSE:LMT) watched its stock rally nearly 6% after unveiling an unexpectedly strong outlook based on more technical progress with its F-35 fighter jet.
At the other end of the spectrum, Procter & Gamble (NYSE:PG) stock was off almost 3% despite a third-quarter earnings beat. Investors are concerned that P&G will struggle to remain in the shaving business.
Headed into Wednesday’s action, it’s the stock charts of Invesco (NYSE:IVZ), Unum Group (NYSE:UNM) and PNC Financial Services Group (NYSE:PNC
) that merit the closest looks as trading prospects. Here’s the deal.
PNC Financial Services Group (PNC)
PNC stock spent the better part of March and April fighting its way out of 2018’s technical funk and back into an uptrend. That has happened in earnest now. But, while some of the heavy lifting has been done, there’s one more line to cross. The good news is, with Tuesday’s action in view, that’s likely to happen straight away.

Click to Enlarge
- The game-changing event here is a move out of the weekly chart’s bearish channel, framed by yellow dashed lines.
- But, just as telling is the fact that the white 200-day moving average line that was resistance in March appears to have become support as of yesterday’s bar.
- There may be more bulls out there than it readily appears. Not only was yesterday’s volume well above average, we saw a big accumulation day two weeks ago as well.
- The key to more upside is pushing above this week’s and last week’s technical ceiling at $134.20, plotted in red on the daily chart.
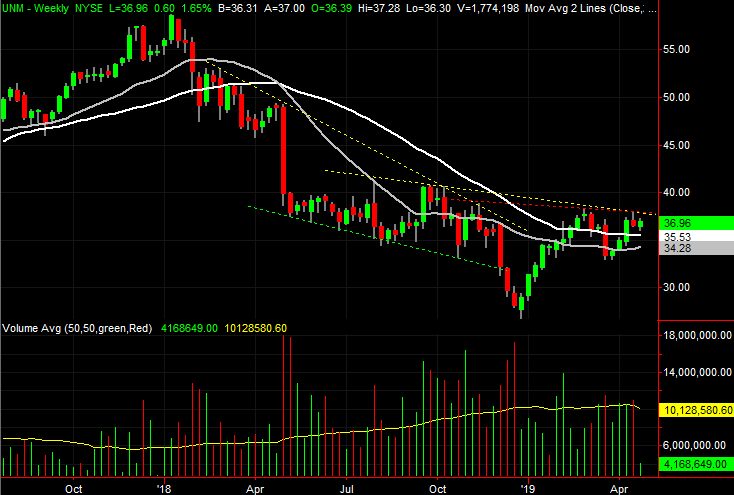
Unum Group (UNM)
Reversals are usually more of a process than an event. If that’s the case for UNM stock right now — and it looks like it is — shares are close to getting over a fairly important hump. That will put it in a position to clear an even bigger hurdle.
In the meantime, the backdrop has already turned impressively bullish.
Click to Enlarge
- Last year was crammed full of lower lows and lower highs. We’ve not yet seen a higher high from UNM stock; March’s low counts as a higher low.
- The higher high will mean a move above horizontal resistance at $40.66, plotted with a green dashed line on the daily chart.
- Before that happens though, Unum shares will have to hurdle the red, dashed resistance line marked on both stock charts. This ceiling touches all the minor peaks seen since November.
- It has largely been lost in the volatility, but as of this week, we now have a golden cross in place. That is, the purple 50-day moving average line is back above the white 200-day moving average line.
- While not the ideal shape, the weekly chart is arguably in the spirit of an upside-down head and shoulders pattern, which sets the stage for a breakout move if and when UNM can punch through the neckline at $37.80.
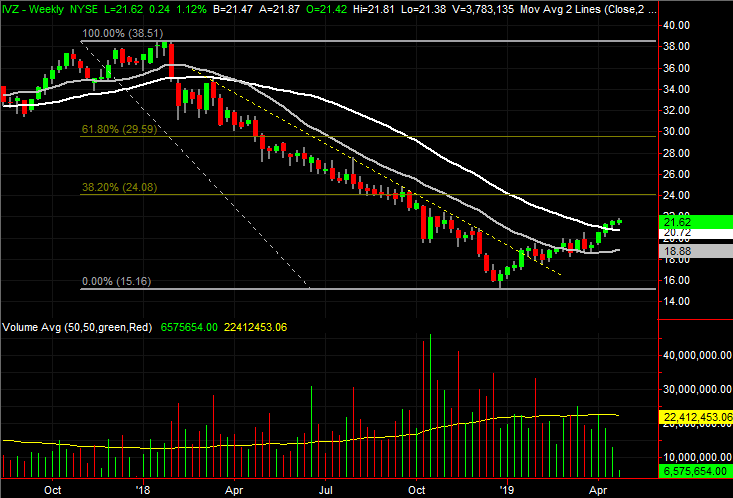
Invesco (IVZ)
Back in early April, IVZ stock was featured as a budding bullish candidate. The downtrend that had been guiding it lower since early 2018 was snapped, by virtue of a break above the falling resistance line in play over the course of the prior several months.
That move is still in place. In fact, it’s stronger now than it was then, as another key hurdle has been cleared. One more push could, and should, seal the deal. And, it’s clear where that line in the sand is.
Click to Enlarge
- The feat achieved in the meantime is a move above the 200-day moving average line, plotted in white on both stock charts.
- Although the cross above the 200-day line is complete, immediately after that happened the advance came to a halt. In the meantime, it has become clear that last week’s peak, plotted in red at $21.74, is a milestone that could trigger another wave of buying.
- If the next leg of the breakout falls into place, the next most likely technical ceiling is around $24, where the 38.2% Fibonacci retracement line currently awaits.
- While the momentum is gaining steam, note how the volume has been fading on the way up since last month. This isn’t necessarily the majority opinion.
As of this writing, James Brumley did not hold a position in any of the aforementioned securities. You can learn more about James at his site, jamesbrumley.com, or follow him on Twitter, at @jbrumley.