What started out as another record-breaking day for the market ended on a sour note. Already feeling the weight of incredible gains, the wrong interest rate rhetoric from Fed chief Jerome Powell sent the S&P 500 to a close of 2,923.73, down 0.75% from Tuesday’s final trade.

Advanced Micro Devices (NASDAQ:AMD) set the tone, and pace, for that pullback, losing 3.0% following a Q1 earnings report that was better than what analysts were expecting, but it still failed to fully satisfy traders’ unspoken expectations. Molson Coors Brewing (NYSE:TAP) fell more than 7% after missing its first-quarter forecasts.
There were a handful of winners. Apple (NASDAQ:AAPL) was one of them, jumping nearly 5% in response to a quarterly earnings report that topped relatively low expectations. Sales, as well as unit sales of the iPhone, were down year-over-year, but investors were and still are optimistic about the potential of its services business.
None are great trading prospects headed into Thursday’s session though. Rather, it’s stock charts of Brighthouse Financial (NASDAQ:BHF), ConocoPhillips (NYSE:COP) and Cisco Systems (NASDAQ:CSCO
) that are shaping up as your best bets. Here’s what’s happening, and what has to happen next.
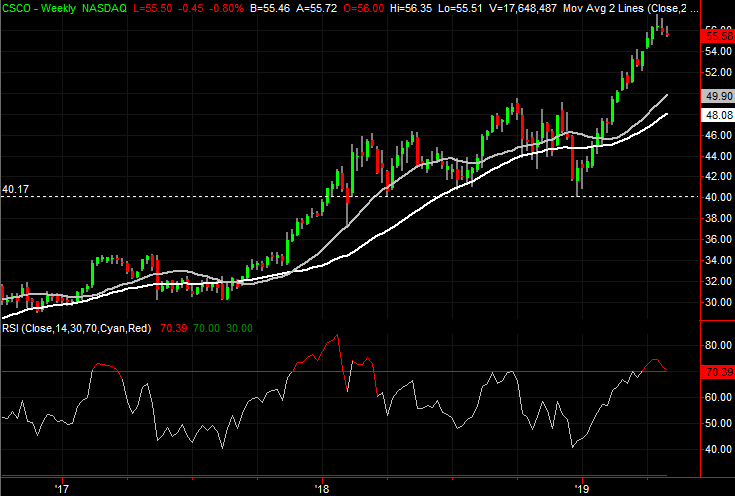
Cisco Systems (CSCO)
The tone and timbre of Cisco Systems changed late last month, by virtue of a move out of a well-established uptrend and into a sideways rut. CSCO isn’t in an irreversible downtrend just yet. But, as of yesterday’s action, it’s one bad day away from falling into more serious trouble.
Just as bad, there’s a ton of room and reason for Cisco to slide lower if the bears can deliver just one more decent blow. The stage is already set.
Click to Enlarge
- The make-or-break line is around $55.40, plotted in red on the daily chart. Cisco has found a low near the first three days of this week.
- CSCO shares are certainly ripe for some selling. The stock is now 16.7% above its white 200-day moving average line, which is about as much divergence as shares have demonstrated in the past.
- Fanning the flames of a potential pullback is the weekly chart’s RSI indicator now being in bullish territory above the 70 level.
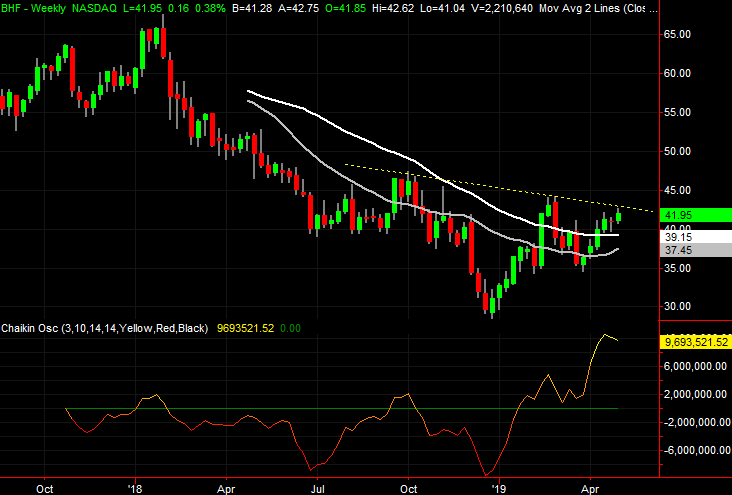
Brighthouse Financial (BHF)
Brighthouse Financial isn’t exactly a household name. Not only is its $4.9 billion market cap just not enough weight to garner much in the way of media attention, but the company has also only been a publicly traded entity since the middle of 2017, when it was spun off from Metlife. It didn’t get started on a great foot either, falling out of the gate, and then continuing to fall through late last year.
The past few months have been distinctly different though, and decidedly better. They’ve been so good, in fact, that the stock is one step away from kicking off a self-fueled rally supported by an oddly low valuation.
Click to Enlarge
- Last month, BHF pushed its way back above the 200-day moving average line, plotted in white on both stock charts. This instance looks like it’s going to stick.
- As of this week, the purple 50-day average has crossed above the aforementioned 200-day line. This event, highlighted in blue, is called a golden cross and generally portends the beginning of a bigger rally.
- The volume since the turn in January has been leaning bullishly, as suggested by the fact that the weekly chart’s Chaikin line is above zero, and still rising.
- The last line to watch is the resistance line that tags all the peaks since October. That technical ceiling is plotted with a yellow dashed line on both stock charts.
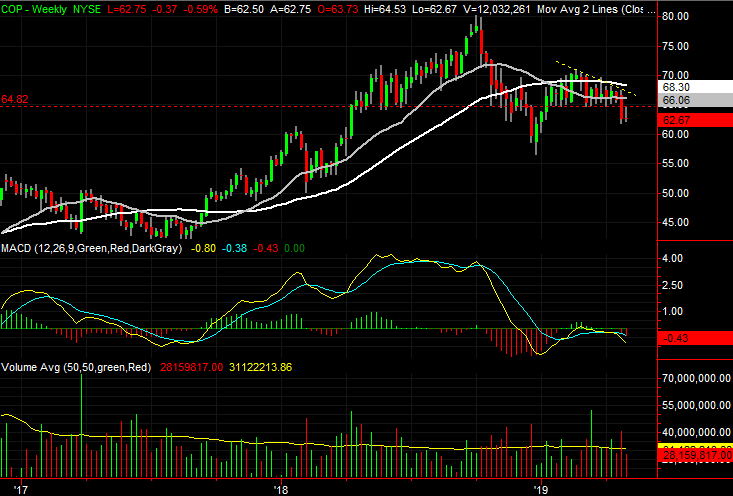
ConocoPhillips (COP)
When we last looked at ConocoPhillips a week ago, it had just broken below a key technical support level, but it had been meeting increasingly tough resistance for several weeks. The stock followed through on that rekindled downtrend that very day. But, it was a flawed follow-through in that it left behind a gap that needed to be filled.
Sure enough, the stock bounced, closing the gap yesterday. The stock may well be back in serious trouble again though, given the shape of Wednesday’s bar and the backdrop of that move.
Click to Enlarge
- The gap is highlighted on the daily chart. Yesterday’s high of $64.53 filled the gap, but the sellers tore right back in to close near the low for the day. That’s a sign that the mode remains net-bearish.
- Bolstering the bearish case is the degree of volume behind Wednesday’s rollover. But, that wasn’t exactly a shocking development. Bearish volume has been above average and growing since mid-April.
- For better or worse, ConocoPhillips is still being pushed around by the sentiment surrounding oil and natural gas prices. COP can’t be traded entirely in a vacuum.
As of this writing, James Brumley did not hold a position in any of the aforementioned securities. You can learn more about James at his site, jamesbrumley.com, or follow him on Twitter, at @jbrumley.