Much like Tuesday’s action, Wednesday saw a rough start for stocks. Unlike Tuesday though, the market wasn’t able to make anywhere near the kind of recovery it made the day before. Yesterday, the S&P 500 fell 1.65%, putting the beginning of a bigger pullback on the radar.

Mylan (NASDAQ:MYL) led the charge, falling nearly 24% after falling short of its first-quarter revenue estimates and then serving up an outlook that failed to assure shareholders. Papa John’s International (NASDAQ:PZZA) fell nearly 4% headed into its post-close earnings report, though a first-quarter beat drove the stock back to where it was in after-hours action on Tuesday evening.
Although few and far between, there were some winners. The most noteworthy of them was the 9.2% advance from NCR Corporation (NYSE:NCR) in front of an earnings report that also revealed a buyer was interested in acquiring the company.
None are great prospects headed into the midpoint of the week, however. Rather, the stocks charts of F5 Networks (NASDAQ:FFIV), salesforce.com (NYSE:CRM) and DISH Network (NASDAQ:DISH
) are of the most interest. Here’s why.
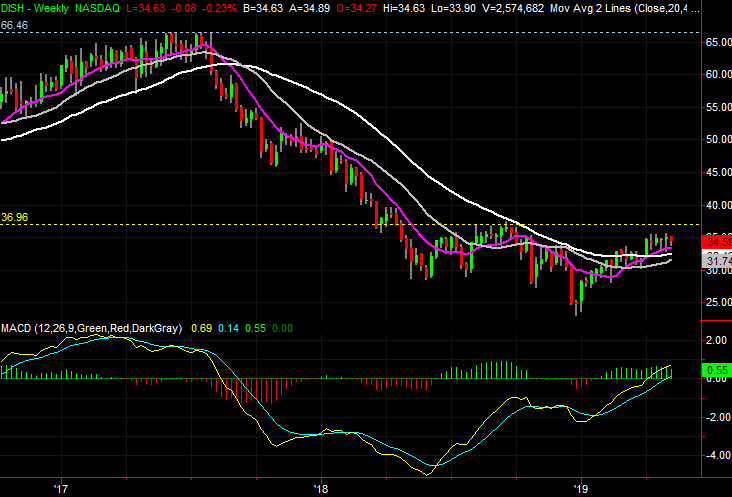
DISH Network (DISH)
When we last looked at DISH Network back on April 11, it had just broken above a minor resistance line as part of a bigger-picture turnaround. While far from complete, it was another good step toward a huge recoupment of 2017’s and 2018’s meltdown.
DISH stock hasn’t actually made any net progress since then. But, the backdrop has continued to improve, setting the stage for a breakout move that’s well within sight.
Click to Enlarge
- The big technical hurdle cleared a little less than a month ago is the resistance line at $33.70, plotted in red, where DISH Network shares peaked in November and again in February before punching through in April.
- The bigger technical ceiling is still around $36.90, plotted with a yellow line on both stock charts. That’s where DISH topped before the Q4 meltdown.
- The key change in the meantime is the purple 50-day moving average line’s cross above the white 200-day moving average line (highlighted). This technical event suggests the beginning of at least an intermediate-term rebound move.
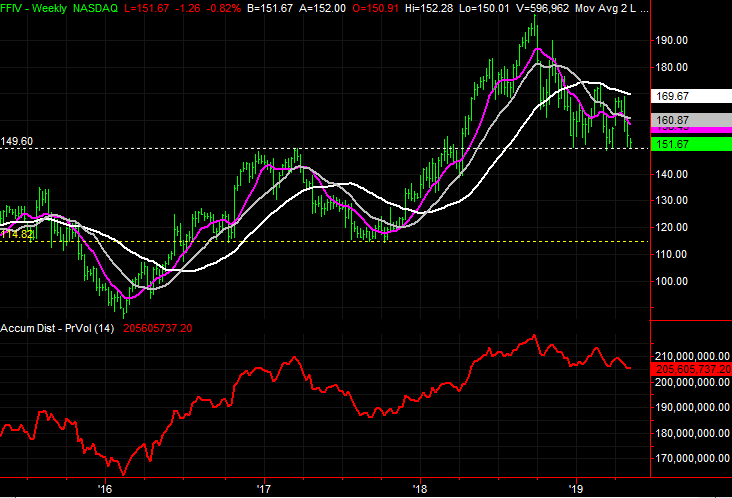
F5 Networks (FFIV)
F5 Networks shares have been trending lower, albeit erratically, since peaking in September. That’s a stark difference with other names as of January. Nevertheless, the bulls have at least drawn a line in the sand, preventing matters from going from bad to worse.
That effort is weakening though, with yet another test of a key support level now underway. In the shadow of a lower high and a handful of other red flags, current owners should be concerned, and potential short-sellers may want to keep close tabs on the chart.
Click to Enlarge
- The make-or-break line is around $149.60, plotted in white on both stock charts. That level has kept the stock propped up since December.
- All four key moving averages are now sloped downward, making clear that the momentum is bearish in multiple timeframes. That’s a key characteristic of trends pointed in either direction.
- Should the floor near $149.60 and fail to hold FFIV stock up, the next most likely downside target is around $114.80, plotted in yellow on the weekly stock chart.
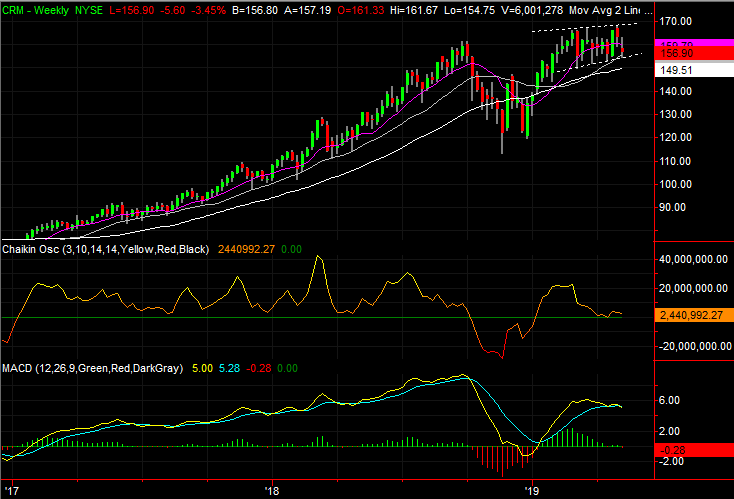
Salesforce (CRM)
Through the latter part of 2018, Salesforce remained a story stock, driven by hope more than fundamentals. The fourth-quarter drubbing, however, appears to be something of a wakeup call. CRM stock bounced back in January and February, but the effort stalled out in a big way beginning in March.
So far, it’s nothing more than a pause that’s well framed by recently developed support and resistance lines (plotted in white on both stock charts). Given the fact that the story stock aspect has shown new vulnerability and a trading range has formed, a break below the lower edge of that range could be the beginning of a paradigm shift … for the worst.
Click to Enlarge
- The lower edge of the near-term trading range currently stands at $154.80, tagging all the key lows made since March.
- If the lower boundary of the trading range fails to hold the stock up, the white 200-day moving average line could still serve as support. If it fails too though, CRM may not bounce back for a second time like it did four months ago.
- Zooming out to the weekly chart we also see a fresh bearish MACD convergence and a Chaikin line that’s on the verge of falling below zero. Both, when seen at the same time, have historically signaled major selloffs for this particular stock.
As of this writing, James Brumley did not hold a position in any of the aforementioned securities. You can learn more about James at his site, jamesbrumley.com, or follow him on Twitter, at @jbrumley.