
The stock market largely dodged a bullet on Monday, but it wasn’t so lucky on Tuesday. Indices were hammered on the day, with many falling almost 2%. What does that mean for individual stocks? Let’s see some must-see stock charts.
Must-See Stock Charts #1: Allergan
Click to Enlarge
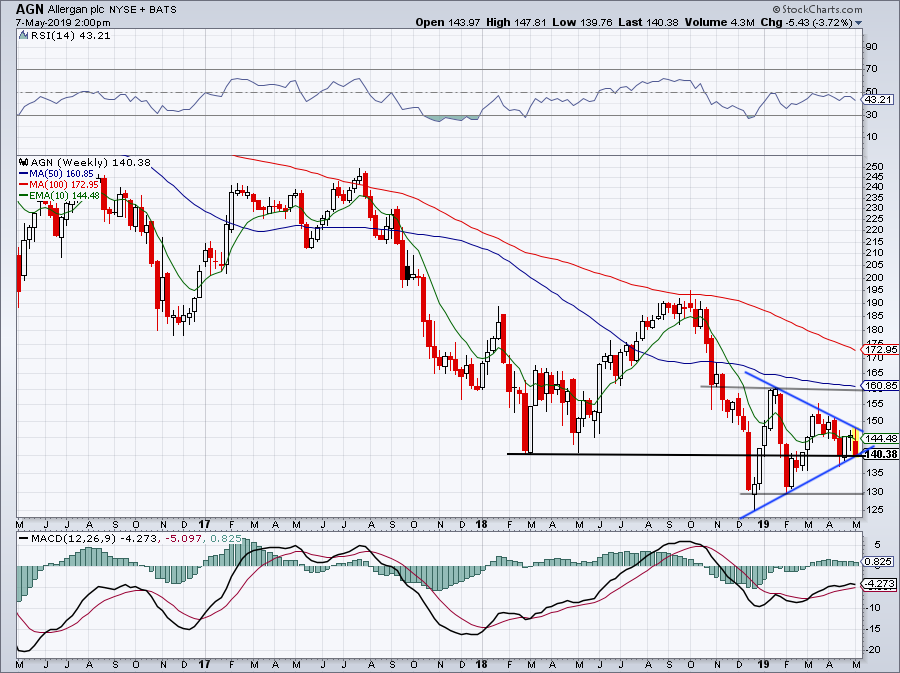
On Tuesday morning, Allergan (NYSE:AGN) delivered a top- and bottom-line earnings beat and raised its guidance. It wasn’t enough to buoy the stock though, with shares falling 5% on the day.
This name has been forming a narrowing wedge since late-December. Some may want to take this one on the long side. Not me. Shares are teetering on a notable level at $140 and are below the 10-week moving average. Allergan is also failing to rally on good headline numbers. Sure, uptrend wedge support could buoy it back up a few bucks, but the potential reward is simply not worth the risk.
Instead, I would rather go long AGN on a break over resistance, as AGN would be clearing downtrend resistance and would have hurdled above its 10-week moving average. Conversely, a close below $140 could trigger a short position with a downside target of $125 to $130.
Must-See Stock Charts #2: Realty Income
Click to Enlarge
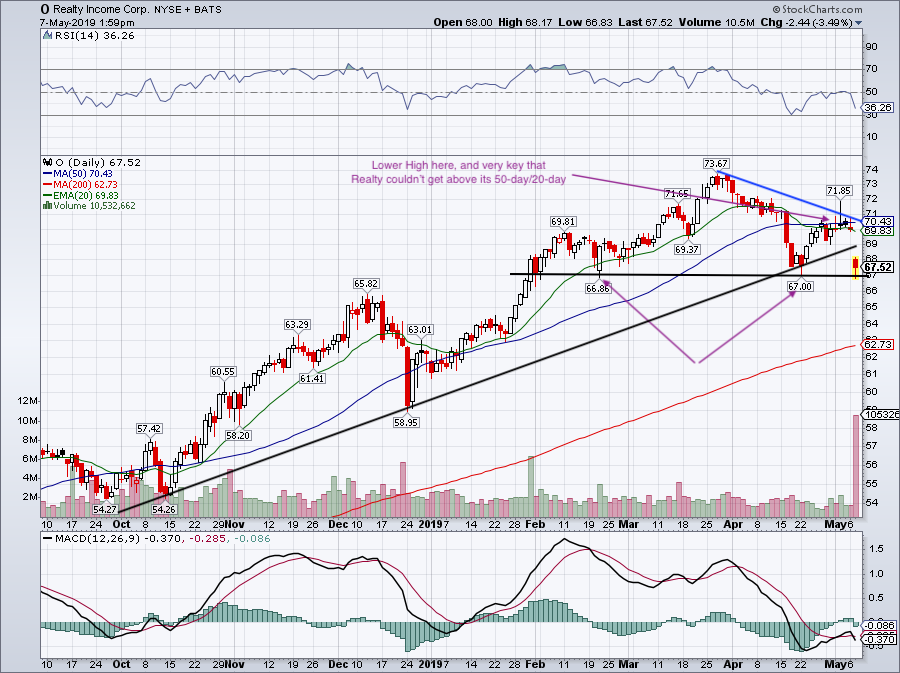
I am really excited to talk about Realty Income (NYSE:O) because the chart is such a great learning opportunity. Last month, we pointed out long-term uptrend support in O, saying it should give the stock a lift near $68 after its sudden decline from $74. Our words were:
“Channel support near $68 could give O a bounce, but if it finds the 50-day or the now-declining 20-day moving average to be resistance, this one could have more selling in its future.”
That’s exactly how it’s played out. Granted, O performed a secondary offering on a tough market day, but it doesn’t matter. The charts show the picture and O’s inability to reclaim its 20-day and 50-day spelled trouble. It didn’t help that the former crossed below the latter, a sign that short-term momentum had waned.
It’s inability to get above these moving averages means the stock put in a lower high, a bearish technical development, and has created — at least for now — a short-term downtrend line (blue).
Shares are now below uptrend support, but are at least holding $67. That’s been a key level since February and a break below could cause a flush.
If you’re trying to get learn about technical analysis and get better at charting, print this chart off. I will too. It’s an amazing example of what to look for and how to spot key levels.
Must-See Stock Charts #3: Boeing
Click to Enlarge
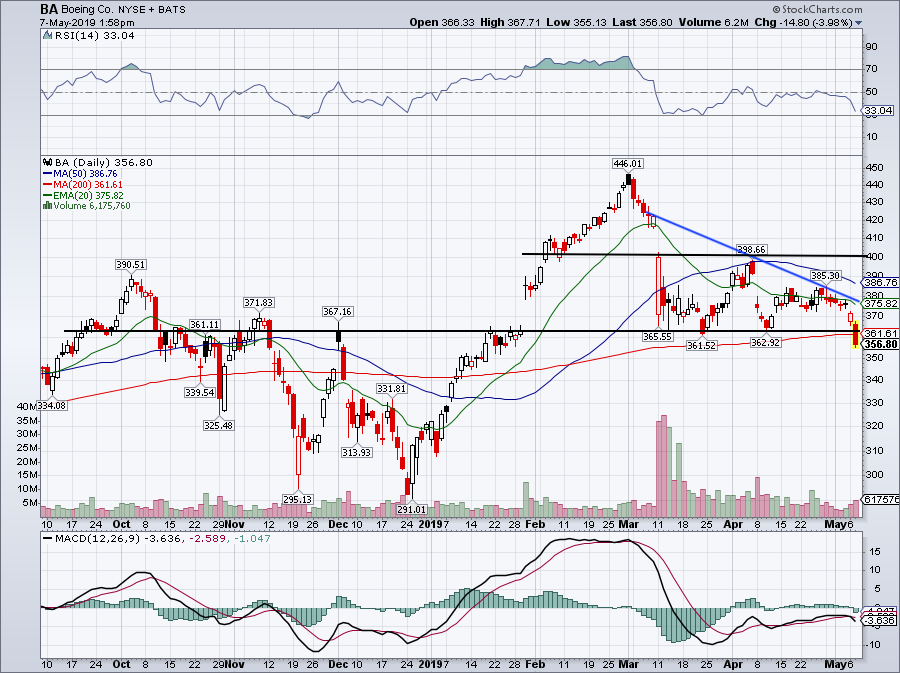
Boeing (NYSE:BA
) is another one for the chart vault. It was no secret that $400 was resistance after the 737 MAX news made big headlines. After all, it failed at that mark twice, while failing to reclaim its 50-day moving average.
As long as $362 held though, BA stock was only down, not out. On Tuesday it lost that level though, along with the 200-day moving average. If it can’t reclaim this level, it may fall back into its prior range between $320 to $360. This breakdown was a big worry of mine last month, even though shares were holding up.
A rally back to this $362-ish area that doesn’t hold gives bears another opportunity reload on the short side. Spot these setups — where struggling stocks can’t break through key levels and moving averages — and see how they handle support.
Must-See Stock Charts #4: Mylan
Click to Enlarge
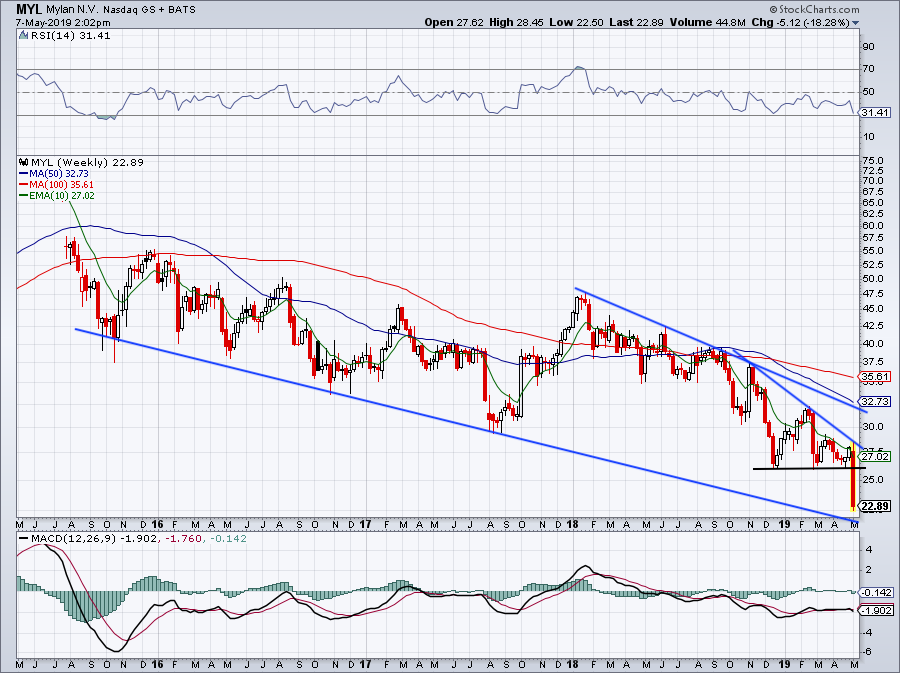
I’m not intentionally picking bearish setups today, but they are the ones that are most prominent with U.S. stocks wilting from their new highs. In Mylan’s (NYSE:MYL) case, shares are down more than 20% after the company reported earnings.
Key support near $26 gave way, as the 10-week moving average and downtrend resistance continues to squeeze the stock lower.
See how the stock handles channel support. It should at least buoy MYL temporarily. If and when buyers return, see how the stock handles $26.
Must-See Stock Charts #5: S&P 500
Click to Enlarge
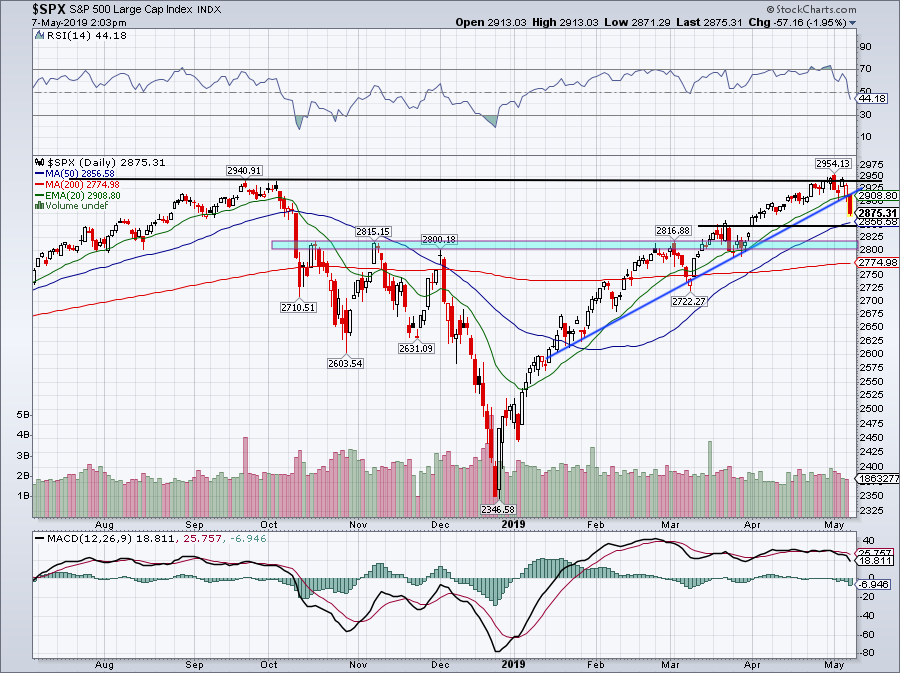
Ooph! What a tough session Tuesday was. The S&P 500 gapped lower on Monday following the president’s tweets on the trade war. We rallied throughout the day and many names closed very strong. It drew in a lot of bulls — I was caught too — that were flushed lower when they pulled the rug on Tuesday.
As hard as it is, try not to be too frustrated by the action. It happens; that’s the stock market. Above everything else, we are risk managers. Our goal is to maximize the potential for reward and minimize our risks.
On the S&P 500 — some may use the S&P 500 ETF (NYSEARCA:SPY) — it clearly broke below uptrend support. The index also lost the 20-day moving average, which told us it’s time to become more tactical now that the trend has broken. A test of the 50-day is practically a given at this point.
The most attractive short-term setup now would be an ugly gap down on Wednesday or Thursday that flushes out many of the weak hands out and gives strong stocks nice buyable pullbacks. A gap below 2,850 that’s quickly reclaimed would give traders an opportunity to add long exposure and play for a bounce over the 50-day.
A bit further down and we should have stronger support in this 2,800 to 2,815 area. Should we overshoot this level, the 200-day is down at 2,775.
Bret Kenwell is the manager and author of Future Blue Chips and is on Twitter @BretKenwell. As of this writing, Bret Kenwell did not hold a position in any of the aforementioned securities.