In the absence of any changes to the Federal Reserve funds rate, and the relatively predictable language surrounding the decision, investors were willing to build on Tuesday’s progress. On Wednesday, the S&P 500 gained another 0.30%, albeit in modest volume.

Shopify (NYSE:SHOP) was the day’s most noteworthy winner, up 7.6% on the heels of news that it would be establishing a fulfillment and distribution network akin to the one built by indirect rival Amazon (NASDAQ:AMZN). China’s electric carmarker Nio (NYSE:NIO) logged an even bigger win though, up roughly 10% between the regular hours and after-hours session, continuing a rebound effort that started to take shape three days ago, somewhat coinciding with the launch of its ES6 crossover vehicle.
Mattel (NASDAQ:MAT) was among the notable losers. The toy company’s stock fell more than 5% after it officially ended merger negotiations with privately held MGA Entertainment. MGA’s CEO Isaac Larian subsequently called Mattel insolvent, saying it can’t be salvaged. The market listened.
As Thursday’s action gets going, however, it’s the stock charts of WellCare Health Plans (NYSE:WCG), Nordstrom (NYSE:JWN) and CF Industries Holdings (NYSE:
CF) that emerge as the most interesting prospects. Here’s why, and what to look for.
CF Industries Holdings (CF)
In late April, CF Industries Holdings was on the verge of a major breakout move. Volume was strong and forward progress was palpable. The ceiling ahead was thick and strong, but could have proven catalytic if CF could punch through.
However, the April effort ended up petering out before getting over the technical hurdle. In fact, CF Industries fell all the way back to an established technical floor around $39. But, the breakout effort that took shape during the first half of this month has finally blasted past the ceiling in question. Although it looks like a little profit-taking may be in store, if CF can hold above the ceiling it makes a renewal of the rally effort all the more likely.

Click to Enlarge
- The resistance level that was finally broken is $45.42, marked with a red dashed line, though the white 200-day moving average line was also an important ceiling that has been put in the rearview mirror.
- Wednesday’s lull was telling, but as long as the $45.42 level, once a ceiling, becomes a floor, the odds of another bullish leg are strong.
- As the weekly chart illustrates, this choppy progress is all part of a much bigger uptrend that extends back to 2016.
WellCare Health Plans (WCG)
A month ago, WellCare Health Plans was featured as a budding breakout candidate. Although a critical ceiling had yet to even be tested, key moving averages were stepping up as support levels. While more volatility was in store, the bullish case was strengthening.
Things have panned out exactly as the charts suggested they would. There’s still a good chance of a near-term pullback, and if the bulls don’t play their cards right, they could squander the opportunity. Nevertheless, the potential here is too good to ignore. The key is when and where the bulls make their next stand in the face of any headwind.
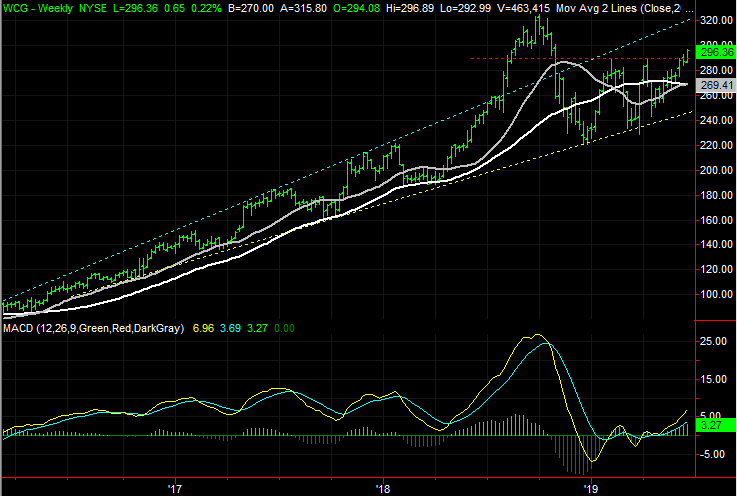
Click to Enlarge
- The big victory since the last look is the move above $289.50, marked with a red dashed line, which until this month had been a ceiling.
- Also, in the meantime, the purple 50-day moving average line crossed above the white 200-day line … a so-called golden cross that portends more gains.
- It’s not an ideal golden cross, however. The 200-day moving average line is actually pointed downward, partially suggesting there’s some lingering long-term weakness.
- The weekly chart shows this is all part of a move within a rising trading channel, framed by blue and yellow lines. This leaves room for WCG to climb to $320, or higher, if it continues to gain traction.
- Although compelling as-is, it might be wise to wait and see if WellCare can bounce back from any upcoming dip back below $289.50.
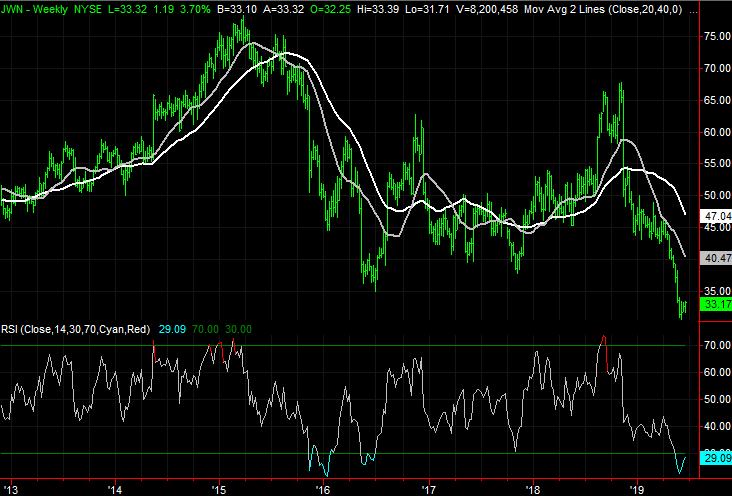
Nordstrom (JWN)
One good day does not make or break a trend. But, all trend reversals start with one day. Nordstrom may have had such a day yesterday.
The 3.2% gain was admittedly easy to make, and barely scratched the surface of a multi-month downtrend that shaved nearly 50% of the stock’s price seen in November of last year. There’s also a massive amount of repair work that would need to be done to make this the beginning of a long-awaited turnaround. But, some of the clues are starting to pile up, and it’s clear where the biggest lines in the sand are.
Click to Enlarge
- Most noteworthy of Wednesday’s bar is the volume surge behind the buying. A lot of bulls suddenly started to pile in for reasons well beyond the market’s mostly bullish tide.
- The daily chart also indicates the $33.42 level, marked with a white dashed line, is turning into a technical ceiling. That level will need to be hurdled before any progress is made.
- The budding uptrend may only be an effort to fill in the gap left behind in March, the upper value of which is $36.65, marked in yellow. But, the effort to do that could actually put a more prolonged buying effort into motion.
- Zooming out to the weekly chart, it’s clear that the current oversold condition indicated by the RSI line frequently coincided with major bottoms.
As of this writing, James Brumley did not hold a position in any of the aforementioned securities. You can learn more about James at his site, jamesbrumley.com, or follow him on Twitter, at @jbrumley.