After a rather rough few weeks, a dead-cat bounce was starting to become inevitable. Tuesday was the day. The S&P 500 bounced 2.14%, crossing back above the 200-day moving average line in the process. It remains to be seen, however, if Tuesday’s action was anything more than a one-off.

Salesforce (NYSE:CRM) was one of the most noteworthy winners, rallying 4% during the regular session and adding another 2% in after-hours action following an impressive Q1 print that was followed by an equally impressive revenue outlook for the full year. Smaller Mattel (NASDAQ:MAT) was an even bigger winner though, jumping nearly 12% after the company announced a licensing agreement to make Hello Kitty merchandise.
None of those names are especially great trading prospects here at the midpoint of the week, however. Instead, take a look at the stock charts of General Mills (NYSE:GIS), eBay (NASDAQ:EBAY) and Intel (NASDAQ:INTC) as your best bets. Here’s why.
Intel (INTC)
To be fair, the 24% pullback from Intel since its April high was largely deserved, if only because last year’s sizeable rally wasn’t deserved. The company let rival Advanced Micro Devices (NASDAQ:AMD) catch up and even out-innovate it.
The scope of the selloff is arguably too great though … a condition the market’s starting to change in an effort to unwind the stock’s oversold condition. That reversal is not only happening exactly when and where one would expect it to, but the key line in the sand has been well defined.
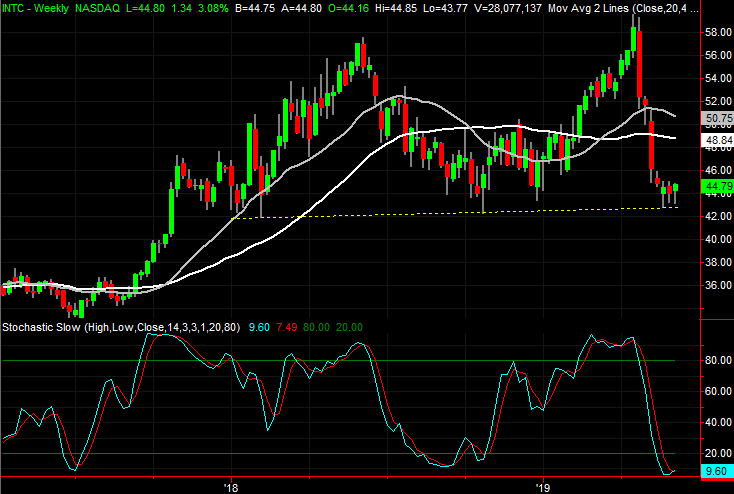
Click to Enlarge
- That line in the sand is $45.12, where Intel peaked a couple of times in the past couple of weeks, and where the blue 20-day moving average line is now.
- The weekly chart is not only stochastically oversold, but the selloff was halted and started to reverse exactly when a major floor plotted in yellow was revisited.
- Although the stage is set, so to speak, it means nothing if INTC can’t actually clear the hurdle at $45.12.
General Mills (GIS)
When we last looked at General Mills back on May 30, a big plunge was actually looking like a setup for a big bounce. A key moving average line held up as support, and the previous day’s bearish gap was begging to be closed.
That rebound effort took shape, pushing up and off the gray 100-day moving average line, closing the gap to boot. But, the shape and placement of yesterday’s bar has all the telltale signs that a pivot out of that uptrend and back into a downtrend may be in the works. What happens today will be a major clue as to what’s in the cards.
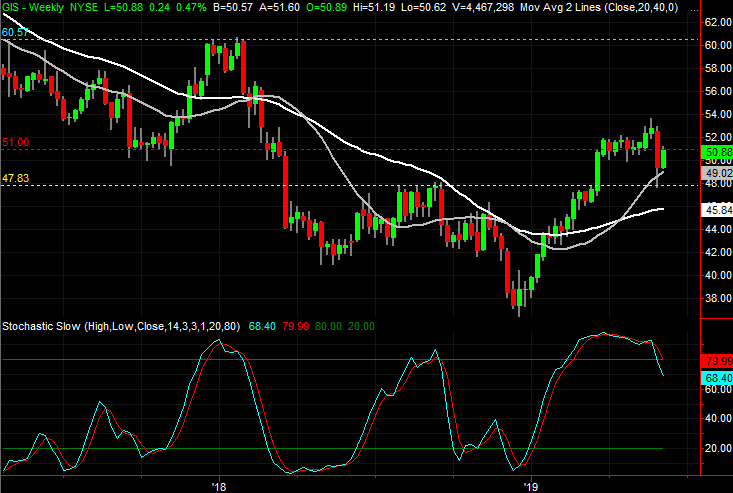
Click to Enlarge
- The first red flag is Tuesday’s doji, where the open and close are both in the middle of the day’s range, and both above the prior day’s (Monday’s) close.
- Bolstering the possibility that the rebound effort has run its course is the fact that the buying effort stopped as the purple 50-day moving average line and the blue 20-day moving average line were approached.
- Notice that the buying effort stopped just as soon as the upper boundary of the gap at $51.05 as filled in.
eBay (EBAY)
As of Monday, eBay shares were back to the brink of a key collapse. As has been the case several times since March, however, the stock was able to push off of a now-established technical floor.
Still, it’s too soon to say EBAY stock is out of the woods. That floor remains within sight, and easy reach, and one bad day could push shares under what may well end up being a catalytic breakdown. The bearish argument is bolstered by another development from yesterday.
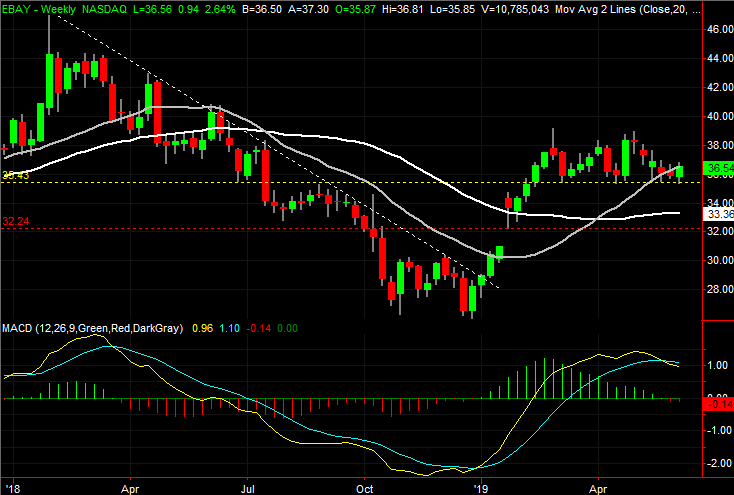
Click to Enlarge
- The horizontal line to watch is $35.45, plotted in yellow on both stock charts, where eBay has found support several times since March’s low.
- Zooming out to the weekly chart we see we’ve already got a bearish MACD crossunder.
- Although eBay managed to squeeze out a gain on Tuesday, it’s concerning that the buying effort faded once the blue 20-day moving average line was kissed.
As of this writing, James Brumley did not hold a position in any of the aforementioned securities. You can learn more about James at his site, jamesbrumley.com, or follow him on Twitter, at @jbrumley.