A sizeable chunk of Tuesday’s intraday gain was given back before the closing bell rang, though even then the S&P 500 was able to muster a 0.97% win. But, between the bullish gap and the headlines needed to make it happen, it’s anyone’s guess as to where things go from here.

Snap (NYSE:SNAP), parent company of Snapchat, was arguably the most noteworthy winner, rallying nearly 10% after BTIG upped its price target to $20. General Electric (NYSE:GE) did more to help the overall market though, gaining almost 4% after long-term doubter John Inch, analyst with Gordon Haskett, conceded that at the very least, GE wouldn’t face insolvency. Fanning those bullish flames is a projection that General Electric expects this year’s Paris Air Show to yield at least $35 billion worth of orders.
Holding the market back more than any other name was La-Z-Boy (NYSE:LZB), down 1.5% during the regular hours session, but off more than 8% in after-hours action after posting poor fourth-quarter numbers after the closing bell rang.
Except for GE, none make for great trading prospects headed into Wednesday’s trading. And for that matter, stock charts of McCormick & Company (NYSE:MKC), FMC (NYSE:FMC) and Pfizer (NYSE:
PFE) all look like better prospects than GE from a risk/reward perspective. Here’s why.
Pfizer (PFE)
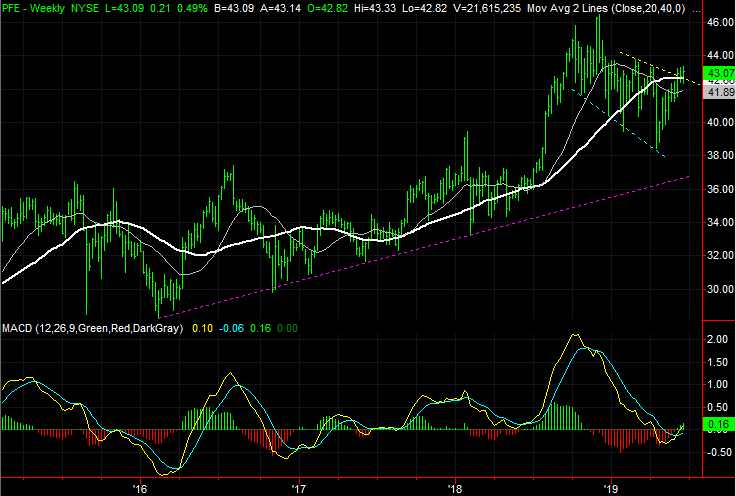
A little less than three weeks ago, Pfizer was featured as a name that was about to break out, but would have to clear an incredibly tough hurdle to do so. It did so. Namely, it not only broke above the upper boundary of a falling trading range, but broke above the pivotal 200-day moving average line, plotted in white on both stock charts.
It’s what has happened in the meantime that merits this second look. Although progress has been slow, thanks to yesterday’s renewed strength, PFE is entirely back above the 200-day line and now knocking on the door of another resistance level. A move above that ceiling could prove catalytic, as there are no major technical ceilings left standing in the way.
Click to Enlarge
- The last line in question is $43.34, marked with a white dashed line on the daily chart. That’s where Pfizer peaked in April, and where it peaked earlier this month. Shares are one good day away from moving above it.
- Beyond that, plotted in red, the highs around $43.80 are the next most likely stumbling blocks, though it’s likely they’re not a terribly big factor at this point.
- Bolstering the bullish case is how much volume took shape behind yesterday’s modest advance. It’s a subtle hint there are more bulls waiting in the wings, if they can just find enough to be confident about.
McCormick & Company (MKC)
McCormick & Company shares were nothing but bullish between January’s deep low and the rally through early April … a move that reclaimed a miserable last few weeks of last year and rekindled the bullishness from the bulk of 2018.
The past several weeks have been decidedly less bullish though. While still making forward progress, that progress was shallow and only driven by a modestly rising support line. And as of Tuesday, that line is on its last legs, and the sellers are starting to turn into a horde.

Click to Enlarge
- The support line in question is marked as a white dashed line on both stock charts, tagging all the key lows going back to early April. You have to look closely to see it, but Tuesday’s weakness actually broke under that line.
- Simultaneously, yesterday’s 1.18% setback dragged MKC under the purple 50-day moving average line, which had served as a support line earlier in the month.
- Zooming out to the weekly chart of McCormick & Company we can see weakness has already developed in earnest, even if the trend is still “up.” The Chaikin line is en route to fall below zero, and we’re just one more bad week away from a bearish MACD crossunder.
FMC (FMC)
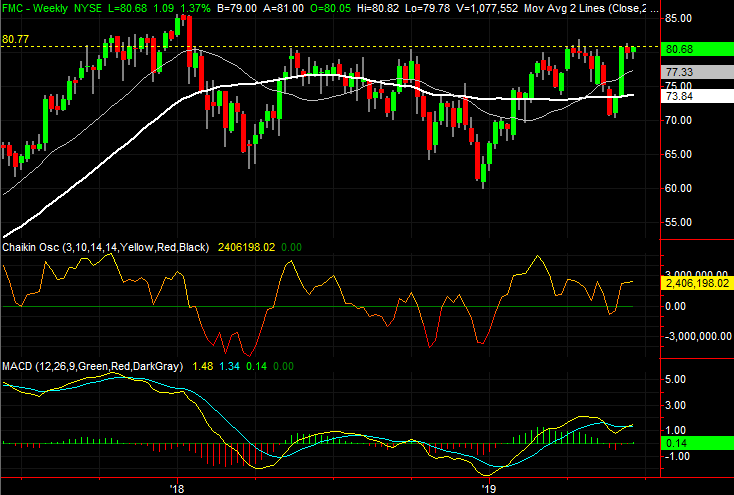
Since the middle of last year, FMC has made several attempts to break above what’s become a well-established resistance line right around $80.75. Clearly each attempt has failed, resulting on various levels of selloffs.
The buyers are at it again though, and this time the outcome may well be different. This time, the effort is starting out from a point that wasn’t so deep in the hole. With less ground to cover just to get into position for a breakout thrust, there’s more gas in the tank to actually get the stock over the hump.
Click to Enlarge
- That “hump” is plotted with a yellow dashed line on both stock charts. Although not perfect resistance, it’s clear there’s something about that level holding FMC shares back. If it can be hurdled, the buying floodgates could readily open.
- Last month’s low around $71 is a much healthier start to the effort than the December low near $61 was.
- Backing out to see the weekly chart we can readily identify a bullish undertow in the Chaikin line as well as with the fresh MACD crossover.
As of this writing, James Brumley did not hold a position in any of the aforementioned securities. You can learn more about James at his site, jamesbrumley.com, or follow him on Twitter, at @jbrumley.