The market launched some pre-Independence Day fireworks of its own on Wednesday, rallying 0.77% in a light volume session that ended early. Still, the move to a new record high sets the stage for optimism headed into the final trading day of the week.

Symantec (NASDAQ:SYMC) was the ringleader for the rally, up more than 13% following news that Broadcom (NASDAQ:AVGO) would be acquiring it at a fairly generous premium. Broadcom, conversely, sank on worries that it was buying another troubled software business.
At the other end of the spectrum, Electronic Arts (NASDAQ:EA) stumbled 4.5% mostly in response to a commentary from MarkWatch columnist Jurica Dujmovic suggesting that PC gaming was shrinking market. Although EA publishes more than computer games, it’s a significant piece of its revenue mix.
As for today’s top trading prospects, take a look at the stock charts of Citizens Financial Group (NYSE:CFG), NRG Energy (NYSE:NRG) and M&T Bank (NYSE:MTB
). Here’s why, and what needs to happen next.
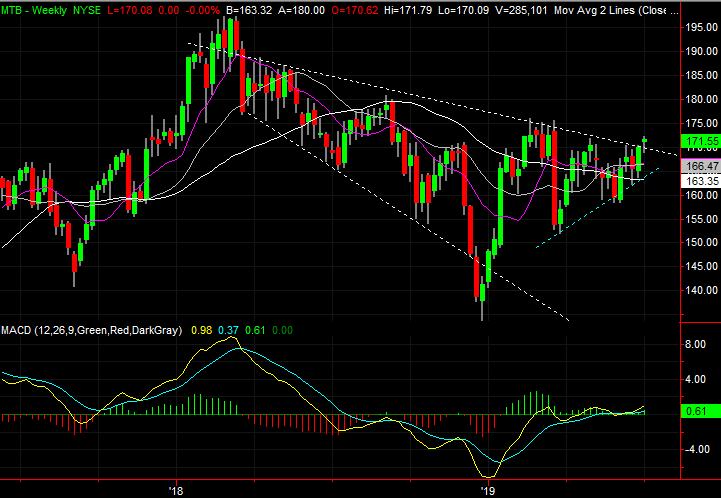
M&T Bank (MTB)
Most bank stocks have been rising lately, shrugging off weakness from late last year and early this year spurred by concerns of falling interest rates, and an outright economic slowdown. M&T Bank hasn’t been an exception to this norm.
MTB has hammered out a turnaround effort that’s much more technically sound than those efforts from other banking names, however. Better still, that move has technically solidified in just the past few days, setting the stage for more forward progress.
Click to Enlarge
- M&T has crossed above all of its key moving average lines, but more importantly, the purple 50-day moving average line is now above and pulling away from the white 200-day moving average.
- Zooming out to the weekly chart we can also see MTB shares have pushed their way above the falling resistance line that had been guiding it lower since early last year.
- Although it has been choppy and should remain so in the foreseeable future, the higher lows made since March is the first string of higher lows made in over a year.
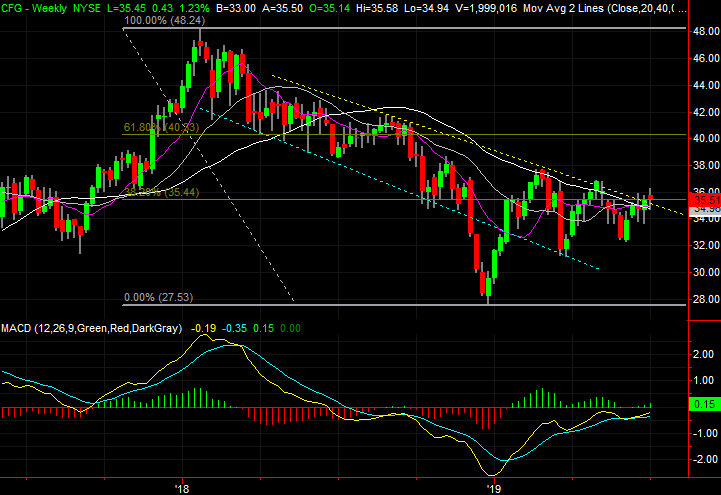
Citizens Financial Group (CFG)
In the same vein as M&T Bank, and for the same reason, Citizens Financial Group shares have just wiggled their way out of a rut and almost back into an uptrend. In this case, however, there’s one last clear technical hurdle to get past before the advance has an unfettered path higher.
Click to Enlarge
- That resistance level is plotted in purple on the daily chart, connecting all the peak highs since February.
- Although not quite yet, the purple 50-day line is about to cross above the 200-day moving average line plotted in white on both stock charts. Once that happens we’ll have a key “golden cross” fanning the bullish flames.
- That being said, Citizens Financial Group have already fought their way back above a key ceiling for a third time. That’s the 38.2% Fibonacci retracement line at $35.44. That puts the next key ceiling somewhere around $40.50.
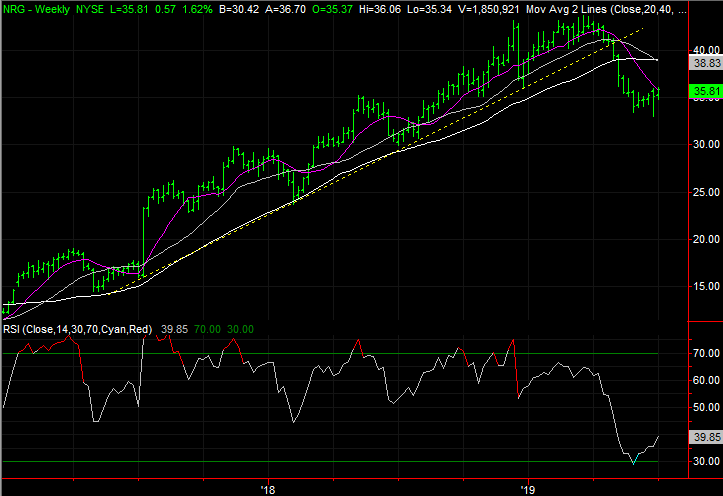
NRG Energy (NRG)
Two months ago, NRG Energy shares were in serious trouble. Not only had they broken below the pivotal 200-day moving average line, they fell below a long-standing and rising support line that had been guiding NRG stock upward since 2017.
Shares proceeded a little lower following the bearish catalyst, and may still be destined for a renewal of that downtrend. But, a chart pattern that took shape last week has major bullish implications that could easily lead to a full-blown recovery.
Click to Enlarge
- The pattern in question is highlighted on the daily chart. A sizeable setback followed by a hammer-shaped bar near the previous day’s low followed by a tall bullish bar. Called a morning doji star, it suggests a transition from a net-bearish to a net-bullish environment.
- Bolstering the potential bullishness is the weekly chart’s RSI indicator. It slipped into oversold territory for the first time in months in May.
- The follow-through has been respectable so far, though not perfect. The purple 50-day average could still act as resistance.
As of this writing, James Brumley did not hold a position in any of the aforementioned securities. You can learn more about James at his site, jamesbrumley.com, or follow him on Twitter, at @jbrumley.