Building on Thursday’s bounce, stocks ended the final trading day of the week, month and first half of 2019 on a high note. The S&P 500’s 0.58% gain didn’t quite carry it back to record-high territory, but that level is within sight and easy reach.

Bank of America (NYSE:BAC) gets a bunch of the credit. Shares of the mega-bank were up nearly 3% on the heels of news that a generous buyback and dividend payment budget has been approved by the Federal Reserve. Constellation Brands (NYSE:STZ) technically logged the bigger gain though, rallying 4.7% on a solid first-quarter revenue beat and equally impressive guidance.
Weighing the market down was the surprising 1.2% for Advanced Micro Devices (NASDAQ:AMD). Although generally a great performer on days that are good for the broad market, traders decided shares were overextended from their outstanding performance through the first half of the year.
Headed into the first day of a trading week that will halt halfway through to celebrate Independence Day, the stock charts of KeyCorp (NYSE:KEY), Procter & Gamble (NYSE:PG) and Mohawk Industries (NYSE:MHK) hold the most interest. Here’s what’s most noteworthy.
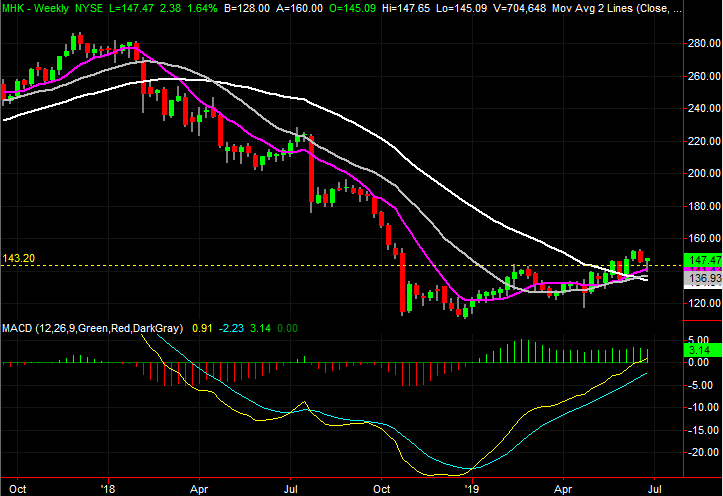
Mohawk Industries (MHK)
Back on May 14, I pointed out Mohawk Industries shares were finding strong support at key moving average lines, which had a good chance of pushing the stock up and over a major resistance level than at $144. Although it was going to take some time and a little luck to make it happen, it was a prospect worth watching.
As of Friday, MHK shares are at $147.47, above a key ceiling not for the first or second time, but a third time. And, it’s this third effort that looks most built to last, as a couple of other bullish clues have materialized in the meantime.
Click to Enlarge
- The $144 area was February’s peak, but as of the middle of May, that was also where the white 200-day line was. That long-term moving average line has since fallen, but either way, Mohawk shares are above it.
- The purple 50-day moving average line has also moved above the 200-day average, creating a so-called “golden cross” that points to a new bullish undertow that should last for a while.
- The pullback in mid-June was daunting, but all it took was a kiss of the 50-day moving average line to reverse course for higher highs again. The fact that the 50-day average is support bolsters the golden cross that took shape last month.
- Zooming out to the weekly chart it becomes clearer how much support a couple of the stock’s key moving averages are now providing.
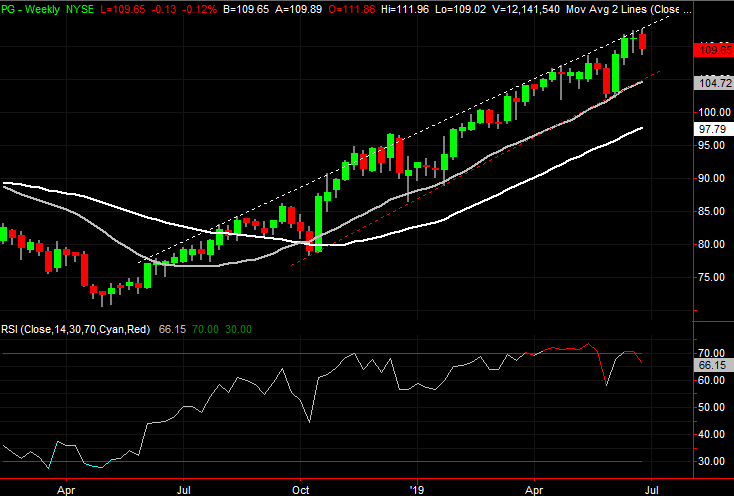
Procter & Gamble (PG)
One bad day doesn’t quell an uptrend. But, two sizeable setbacks in four days and a complete unwillingness to participate in marketwise bullishness is highly suspect.
That’s Procter & Gamble right now. Friday’s loss was hardly devastating, but the close was well under the open, and the volume behind the selloff was significant. The move lower also solidified a pullback effort that has been taking shape since PG stock bumped into a long-established resistance line in the middle of June. It’s all part of a rising trading range, though given the length of the advance, there’s good reason to be concerned the fresh weakness could be an omen of a major correction.
Click to Enlarge
- The prod for last week’s weakness was a new encounter with a rising resistance line, plotted in white on both stock charts, that extends back to May of last year.
- We’ve seen this ceiling push P&G stock lower before, though, usually to no avail. A floor has been established, marked with a red dashed line on both stock charts, but the gray 100-day moving average line may also act as support if tested.
- If neither of those floors holds up in the event of a more serious wave of selling, the next-best support area is the white 200-day line, currently at $96.88 but rising quickly.
KeyCorp (KEY)
In early June, KeyCorp was pegged as a breakout candidate. The stock had been increasingly squeezed into the tip of a converging wedge pattern, and was running out of room. There is a major technical ceiling to clear in conjunction with the upper boundary of the wedge, but if breached, such a move could prove catalytic.
That happened. Although the rally took a breather as the pivotal ceiling was met, the bulls held their ground until they could regroup. Thursday’s advance cracked the ceiling, and Friday’s follow-through move outright broke it. There’s little left to hold the stock back here, particularly if the rest of the banking sector’s stocks continue to advance.

Click to Enlarge
- The upper boundary of the wedge is marked in yellow on both stock charts, but the best bullish argument here is the move above the white 200-day moving average line.
- The thrust is healthier than it may even seem on the surface. For the better part of June, the purple 50-day and gray 100-day moving average lines served as support, turning into a pushoff point for the new rally.
- Despite headed into a weekend that many people will use as the beginning of a vacation, the amount of buying volume grew nicely into Thursday’s and Friday’s sessions.
As of this writing, James Brumley did not hold a position in any of the aforementioned securities. You can learn more about James at his site, jamesbrumley.com, or follow him on Twitter, at @jbrumley.