The bulls tried their best, but the valiant effort to finish last week on a high note failed. The S&P 500 lost 0.18% of its value on Friday, though the broad market is still in record-high territory.

Nvidia (NASDAQ:NVDA) proved to be the biggest drag on the overall market, sinking 1.6% as part of a general malaise among other tech names. Advanced Micro Devices (NASDAQ:AMD), as expected, lowered its pricing in response to planned product launches from it as well as from rival Nvidia. Samsung helped set the pessimistic tone too, warning investors that its next quarterly report’s bottom line could be down by more than half.
But, those names aren’t of a great deal of interest as the new trading week gets going. Rather, it’s the stock charts of Royal Caribbean Cruises (NYSE:RCL), Electronic Arts (NASDAQ:EA) and United Airlines Holdings (NASDAQ:UAL) that are of the most interest. Here’s why.
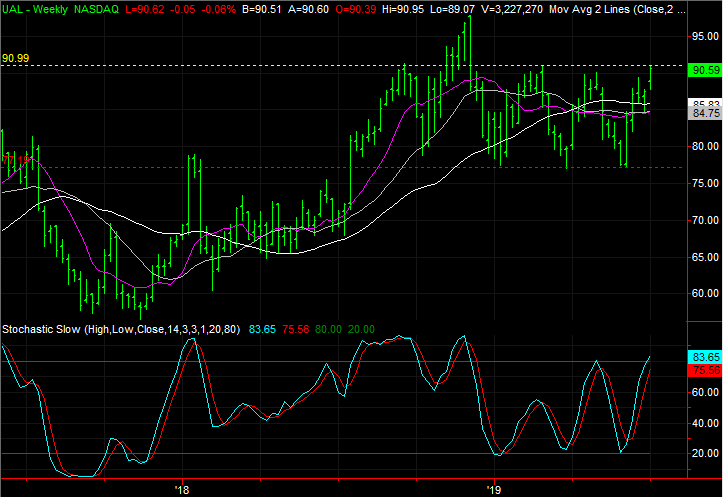
United Airlines Holdings (UAL)
United Airlines shares have been soaring since late May, and thanks to a renewed rally effort since the latter part of June, UAL is knocking on the door of a multi-week high.
On the flipside, as of last week, the recent highs essentially aligns with the peak prices seen since February, which is paired with a corresponding horizontal support line. If the trading range breaks, it could begin a significant move. That’s a big “if” though.
Click to Enlarge
- The range in question lies between $91 and $77.20, marked in yellow and red, respectively, on both stock charts.
- The weekly chart’s stochastic lines also verify that UAL is overbought, and has reached an inflection point. It will have to begin pulling back, or have to finally push into multi-week high territory.
- The current advance has an edge previous ones didn’t. That is, in late June, United Airlines shares were able to push up and off of the purple 50-day average and the gray 100-day line.
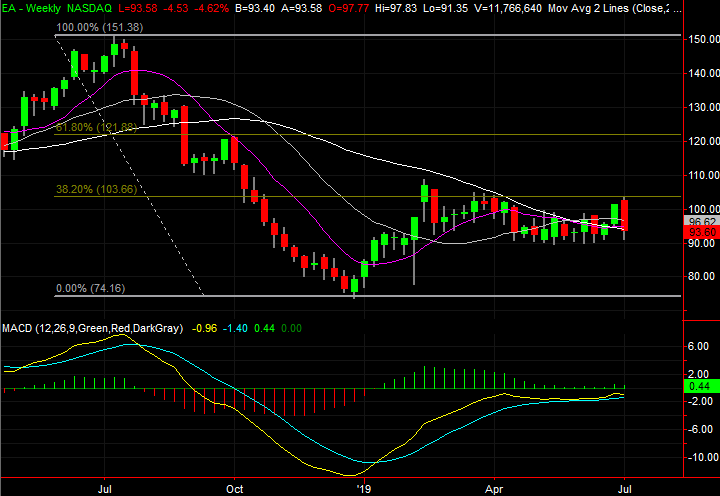
Electronic Arts (EA)
A week ago, Electronic Arts was a rock-solid trading prospect. After weeks of attempts to clear a couple of major resistance lines, the stock finally poked through, and then followed through.
The effort completely unraveled in the latter part of last week, however, with a stumble that dragged the stock almost back to its starting point for the bullish thrust. In many regards though, the setback is actually a bullish event in that it gives the stock a chance to validate the breakout move from two weeks ago.
Click to Enlarge
- Friday’s low was suspiciously in line with the lows booked since May, suggesting the bulls have drawn a mental line in the sand. EA was pushing up and off that floor later in Friday’s session.
- Friday’s volume spike, when paired with a partial intraday turnaround, implies a shift from a net-bearish back to a net-bullish environment.
- It couldn’t be said two weeks ago, but as of Friday, the purple 50-day moving average line has crossed above the white 200-day moving average line. That “golden cross” is seen as a buy signal for some traders, despite the selloff that took shape the day the signal was made.
- The sudden pullback is less surprising considering it materialized right as the 38.2% retracement line was encountered. That ceiling at $103.66 could prove to be a major battleground.
Royal Caribbean Cruises (RCL)
With nothing more than a quick glance, shares of Royal Caribbean Cruises simply look like they’re going through a patch of volatility. That’s nothing new for RCL.
A closer look at some of the daily chart’s nuances, however, says there may be more underway here than a little choppiness. Zooming out to a look at the weekly chart suggests the same thing … that a pattern is repeating itself. Lower lows may be more likely than it seems on the surface.

Click to Enlarge
- For the second time in two weeks, as of Friday, Royal Caribbean shares are back below the white 200-day moving average line. This time though, resistance at the purple 50-day line (highlighted) prompted the pullback.
- It has been inconsistent, though there’s still clear growth in the amount of bearish volume that has started to materialize. There are a lot of would-be selling waiting on the sidelines.
- Backing out to look at the weekly chart clarifies an up and down pattern that has been accurately signaled by MACD lines that have already turned bearish.
As of this writing, James Brumley did not hold a position in any of the aforementioned securities. You can learn more about James at his site, jamesbrumley.com, or follow him on Twitter, at @jbrumley.