
The market had been much higher at one point in the day on Wednesday, buoyed by commentary from Federal Reserve Chairman Jerome Powell who all but said a rate cut was coming, and soon. But, even with the intraday pullback, the S&P 500 ended the day up 0.45%, hitting a record high in the process.
Tesla (NASDAQ:TSLA) gets a little bit of extra credit for keeping the market in the black. Shares of the electric carmaker were up nearly 4% on the heels of news it was planning to ramp-up production at its Fremont, California plant. Memory chip maker Micron Technology (NASDAQ:MU) was up 4% as well after the glut-beleaguered company announced it raised a few billion by issuing some well-received notes.
At the other end of the spectrum, Levi Strauss (NYSE:LEVI) tumbled 12% after the jeans company said the second half of the year wasn’t looking quite as promising as first believed.
None of those picks are great prospects headed into Thursday’s session though. Rather, it’s the stock charts of Davita (NYSE:DVA), Honeywell International (NYSE:HON) and Advanced Micro Devices (NASDAQ:AMD) that look like your best bets, even if not all for bullish reasons.
Advanced Micro Devices (AMD)
Advanced Micro Devices shares, in simplest terms, are at an inflection point. Although the rally since late last year has been persistent and rewarding, for the second time in a month AMD is knocking on the doors of record highs. If the bulls fail once again, this third try may not set up a fourth attempt anytime soon. Rather, this could serve as the pivot into a more prolonged downtrend, and the backdrop is anything but encouraging.
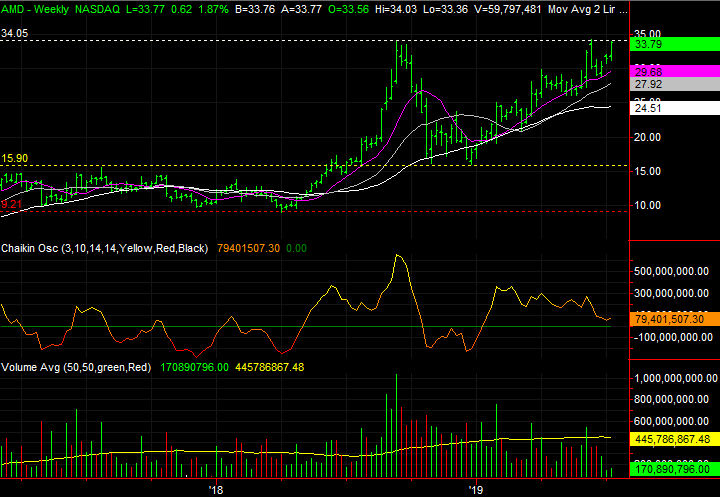
Click to Enlarge
- The ceiling in question is right around $34, plotted in white on both stock charts. This is the third time since mid-2018 it has been tested.
- While the advance appears to have momentum, there’s a stark lack of volume behind the gain thus far.
- A breakout move past the $34 area could be catalytic, but if volume doesn’t materialize in a big way, it could also be nothing but a setup for an even bigger wave of profit-taking.
Davita (DVA)
In a perfect world a stock’s trading action would always make sense, and moves — higher or lower — wouldn’t need prodding. We don’t live or trade in a perfect world though.
With that as the backdrop (and perhaps with a bit of irony thrown in), this week’s drubbing of Davita shares may be the very thing they needed to restart a bigger-picture rally effort that ultimately failed to follow through last week. It was news that prompted the shakeup, which isn’t ideal. It’s still the hand traders were dealt though.
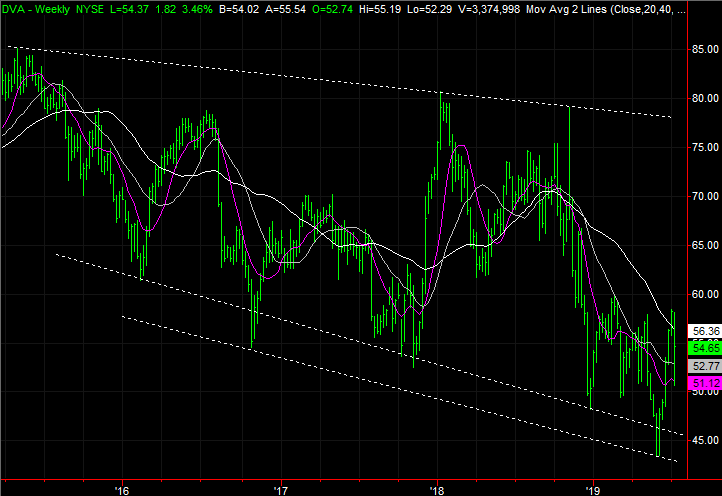
Click to Enlarge
- As of last Friday, DVA had just pushed above its 200-day moving average line, plotted in white on both stock charts. On Monday, that move was completely up-ended, by headlines.
- Tuesday’s miserable opening wasn’t so miserable after all. With some help from the purple 50-day moving average and even more held with a semi-established floor around $50.76, Davita logged a convincing intraday reversal pattern.
- Wednesday’s follow-through was key, and on above-average volume to boot.
Honeywell International (HON)
Finally, it’s far from being in deep trouble yet, but Honeywell International shares are slowly moving in that direction. It’s the pace and nature of the slowdown, in fact, that’s raising so many red flags.
Either, with a runup that has far outpaced the broad market’s gain since the very end of last year, the sheer risk of the rollover turning into something more merits a closer look.
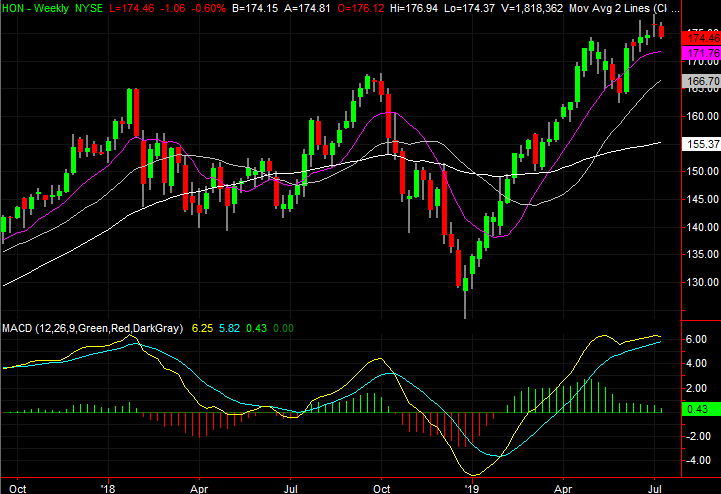
Click to Enlarge
- It’s loosely evident on both stock charts, put the daily chart’s purple 50-day moving average line’s flattening action best shows the gradual slowdown underway.
- The clincher here would be a MACD crossunder on the weekly chart. Such signals have accurately marked sizable pullbacks a couple of times since early 2018.
- It may have more to do with the season than the stock, but there’s been minimal volume behind the worst of the bearish days that have started this slow, arching rollover.
As of this writing, James Brumley did not hold a position in any of the aforementioned securities. You can learn more about James at his site, jamesbrumley.com, or follow him on Twitter, at @jbrumley.