
What started out as a third straight day of losses certainly didn’t end that way. On Tuesday, the S&P 500 mustered a 0.12% gain, giving investors something to build on should they decide the market is safe enough to add long positions here.
Supersized company Amazon.com (NASDAQ:AMZN) did more heavy lifting than any other name, gaining almost 2%. But Square (NYSE:SQ) ultimately won the day’s top-performer honors. Shares of the fintech name rallied more than 6% after Raymond James analyst John Davis upgraded SQ on optimistic expectations about the company’s soon-to-launch business debit card.
Holding the market back more than any other name was telecom outfit Verizon (NYSE:VZ), which was down a couple of percentage points following a downgrade from Citi. Analyst Michael Rollins explains: “[W]e believe national wireless firms that take more aggressive steps to shape their long-term strategic and competitive position in the industry have a better chance of creating value over the next 12-months.”
Headed into the midpoint of the week, however, it’s the stock charts of PepsiCo (NASDAQ:PEP), EQT Corporation (NYSE:EQT) and Lennar (NYSE:LEN) that are of the most interest. Here’s why.
Lennar (LEN)

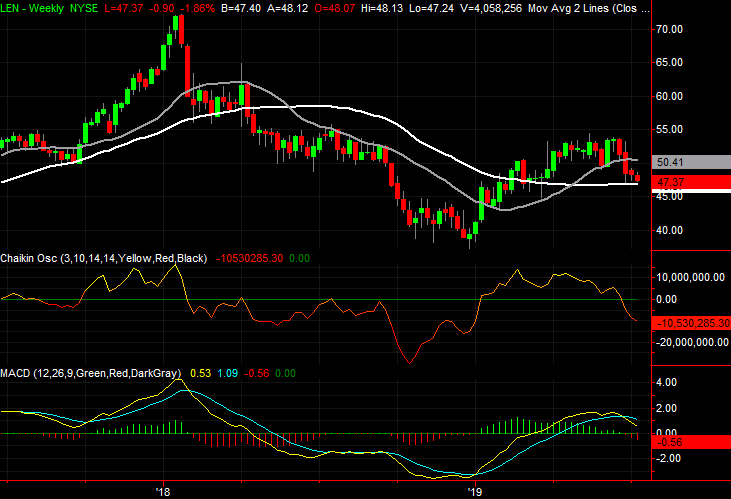
In late June, Lennar was put under the trading microscope. A sharp single-day setback dragged the homebuilding stock under several key moving average lines, and there was no intraday rebound effort. The selloff was so significant, nobody was willing to buy the dip.
The next day, Lennar shares only had to kiss their 200-day moving average line to start a feeble recovery effort. But, it was a recovery effort nonetheless. What happened in the meantime is even more concerning than what happened then.
Click to Enlarge
- The weakness from late June has since been renewed, with Tuesday’s close of $47.37 being the lowest in weeks.
- Tuesday’s slide from a reasonably healthy open was also on above-average volume suggesting more would-be sellers are waiting in the wings.
- While the late-June low near $47, plotted with a yellow dashed line on the daily chart, the 200-day moving average remains the make-or-break line in the sand.
EQT Corporation (EQT)
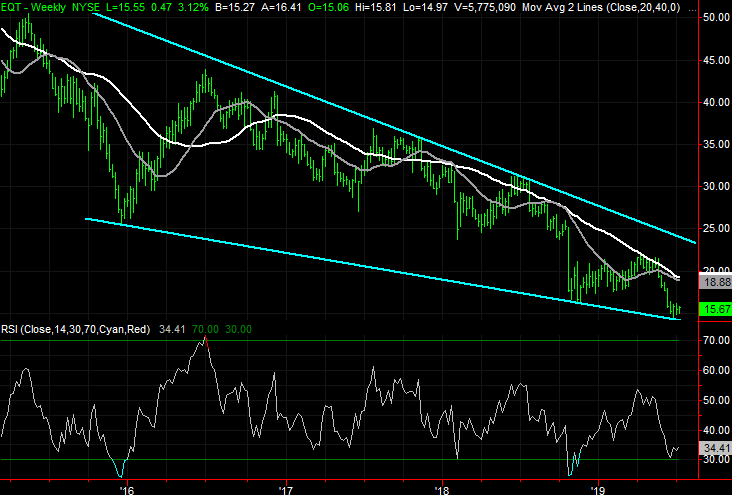
As of the latter half of May, EQT looked like it was in real trouble. A brief encounter with the 200-day moving average line, plotted in white on both stock charts, put the stock into a pretty steep dive.
The selloff was halted at what turned out to be a pretty predictable support area though, and the rebound effort started to take shape. It has been choppy, but thanks to Tuesday’s gain, the first of a key ceiling has been wiped out of the way. And the nature of the effort is even more compelling than the effort seems to be with just a cursory look.
Click to Enlarge
- The big crossover worth noting from yesterday is the move above the blue 20-day moving average line.
- Tuesday’s gain was also an outside day, where the open was below Monday’s low, and the close was above Monday’s high. These drastic intraday swings suggest a major change of heart.
- Although progress has been modest since the latter part of June, the ‘up’ days have been on decidedly stronger volume than the ‘down’ days.
- Zooming out to the weekly chart, all the recent action is put in perspective. EQT is pushing up and off the lower edge of a descending wedge patterns, and any advance could be capped at the upper boundary near $23.
PepsiCo (PEP)
Finally, PepsiCo shares have been playing with fire for weeks now. Although the 24% gain from January’s low was a nice run, it also left PEP shares overbought and ripe for profit-taking.
The stock hasn’t slipped over the edge of that cliff yet. With yesterday’s stumble though, it has become dangerously close to doing so. One more bad day could do the trick, and the backdrop has already turned uncomfortably bearish.

Click to Enlarge
- It was already struggling to do so, but as of Tuesday, PepsiCo shares are decidedly below the blue 20-day moving average line.
- The undertow is made even more bearish in that the volume behind the “down” days since late June has not only been above average, but growing. The Chaikin line’s decline on the weekly chart says the same thing.
- On the weekly chart, the looming bearish MACD crossunder and the impending Chaikin line cross below the zero level leave PEP just days away from two major sell signals.
- The final line in the sand is right around $130.75, where PepsiCo has made lows a couple of times since late last month, and where the purple 50-day moving average line will soon be.
As of this writing, James Brumley did not hold a position in any of the aforementioned securities. You can learn more about him at his website jamesbrumley.com, or follow him on Twitter, at @jbrumley.