Already struggling under the weight of recent gains, investors interpreted some comments from Federal Reserve Chairman Jerome Powell in the worst possible light on Tuesday. The S&P 500 fell 0.95%, perhaps setting a tone for a return to the mean more in tune with June’s usual tepidness.

FedEx (NYSE:FDX) did a bunch of the organic damage, falling more than 3% in front of its post-close fourth-quarter report that was partially undone in after-hours action. AbbVie (NYSE:ABBV) logged the day’s most sizeable loss by a single name, however, losing 16% on the heels of unpopular news that it was acquiring Allergan (NYSE:AGN) at a healthy premium.
At the other end of the spectrum, aside from Allergan’s jump, Caesars Entertainment (NASDAQ:CZR) gained another 1% after investors continued to celebrate its acquisition.
Headed into the midpoint of the trading week, however, it’s the stock charts of Lennar (NYSE:LEN), Tyson Foods (NYSE:TSN) and State Street
(NYSE:STT) that merit the closest looks. Here’s why, and what to look for.
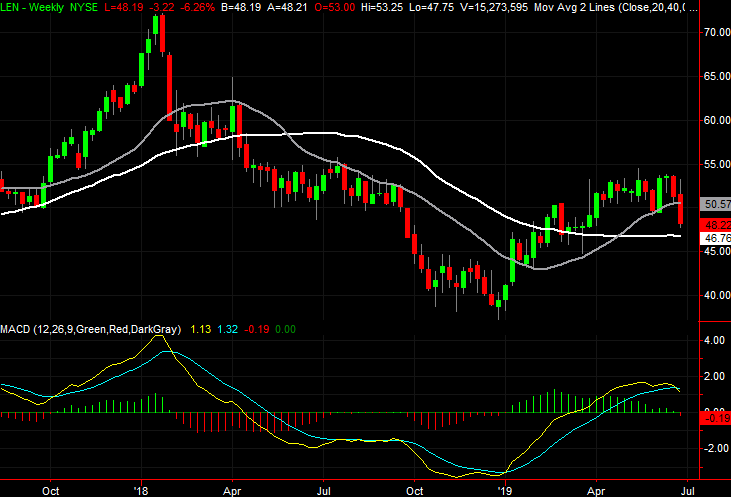
Lennar (LEN)
The one thing worse than a major daily setback for a particular stock is a day that starts out as a gain, and then slips into the red. It suggests a well-reasoned rethinking of the market’s opinion of a company, rather than a knee-jerk response that is just as easily reversed.
That’s what happened to Lennar on Tuesday. Shares of the homebuilder stock opened firmly on a seemingly good enough second-quarter report, but as investors mulled the numbers, they decided they were more of a liability than a success story. The sheer scope of the reversal sets the stage for lower lows in the near future.
Click to Enlarge
- The big bearish swing inflicted more damage than is readily apparent. It was a technical floor last month, but yesterday, LEN stock broke below the 100-day moving average line.
- Yesterday’s volume surge is also a red flag. Major pivots are often marked by a spike in volume. In this case, the pivot is out of an uptrend and into a downtrend.
- Bolstering the bearish case is a detail not evident on the chart of LEN stock. That is, most other homebuilder stocks made a similar meltdown. Groupwide moves are more apt to develop momentum.
- Even so, the bulls are likely to push back a little from here. It’s the next ebb lower that will proverbially seal the downtrend in place. That’s mostly a move below the 200-day average line, in white on both stock charts.
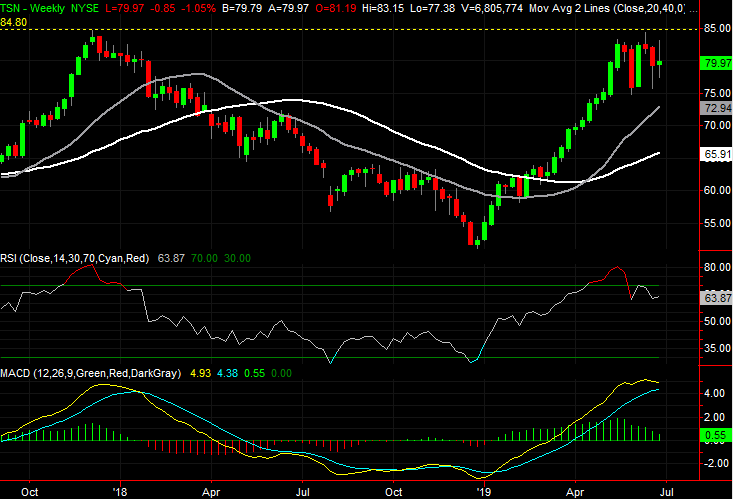
Tyson Foods (TSN)
Tyson Foods shares have been overextended for weeks now, revisiting their multi-year high hit in late 2017. So far the bears haven’t been able to pull the rug out from underneath the stock, but the bulls have been unable to continue on.
As of Tuesday though, Tyson stock became more vulnerable to a pullback than it has been in months. The shape and placement of Tuesday’s bar is everything, particularly when it’s backed by another major red flag.
Click to Enlarge
- Tuesday’s bar is a doji bar, where the open and close are both near the middle of a rather wide low-to-high range. This pattern often indicates a transition.
- The surge in volume, as was the case with Lennar, also suggests a pivot or a transition. In this case, it’s from a net-buying environment to a net-selling one.
- Although vulnerable, it would be naive to ignore the fact that the purple 50-day moving average line has once again acted as a support level.
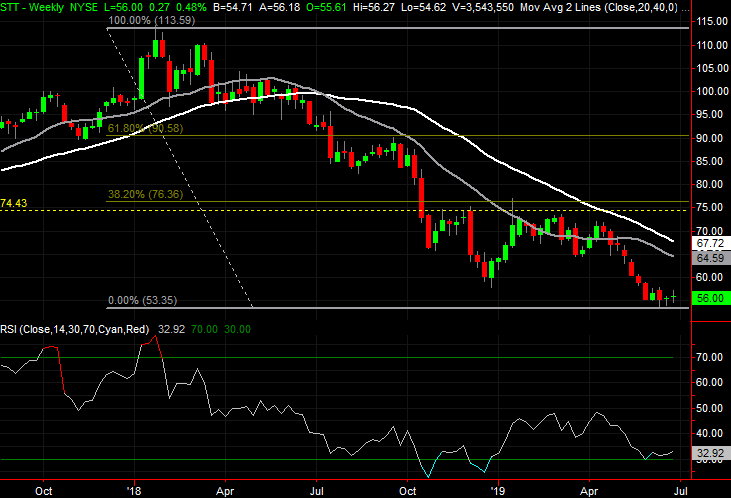
State Street (STT)
Finally, State Street shares may be up just a bit from last week’s lows, though are hardly in an impressive uptrend. A major move may be quietly taking shape though. Many of the telltale signs are already in place. Better still, there’s a clear line in the sand that will have to be hurdled before any of the potential rally matters.
Click to Enlarge
- The line in the sand to watch is near $57.90, plotted with a blue dashed line on the daily chart. That was a ceiling in early June, but also a major low in December.
- Despite the tepid forward progress of late, the buyers are stepping up to the plate in earnest. All the key advances since the end of May have been on above-average volume.
- Backing out to the weekly chart, the most likely ceiling rests somewhere around $75. That’s where a major Fibonacci retracement line lies, and is more or less where State Street topped several times in recent months.
As of this writing, James Brumley did not hold a position in any of the aforementioned securities. You can learn more about him at his website jamesbrumley.com, or follow him on Twitter, at @jbrumley.