Stocks bounced back from Friday’s misery to start the new trading week on renewed hopes for some sort of trade deal with China. But, given the scope of Friday’s meltdown, a bounce was nearly inevitable. Even with Monday’s gain of 1.1%, the S&P 500 is still down 1.5% from Thursday’s close.

Teva Pharmaceutical (NYSE:TEVA) led the way with its 5.2% gain during regular-hours action, followed by more than a 2% pop in after-hours trading on a small wave of encouraging news that emerged for the struggling company last week. Roku (NASDAQ:ROKU) wasn’t far behind though, rallying nearly 4% as investors continue to chase its move into record-high territory.
Holding the market back more than any other name was Philip Morris (NYSE:PM), down more than 4% on rumors it may merge with Altria Group (NYSE:MO).
As for names worth a look headed into today’s action, take a look at the stock charts of TechnipFMC PLC (NYSE:FTI), Constellation Brands (NYSE:STZ) and Vertex Pharmaceuticals
(NASDAQ:VRTX). Here’s why.
Constellation Brands (STZ)
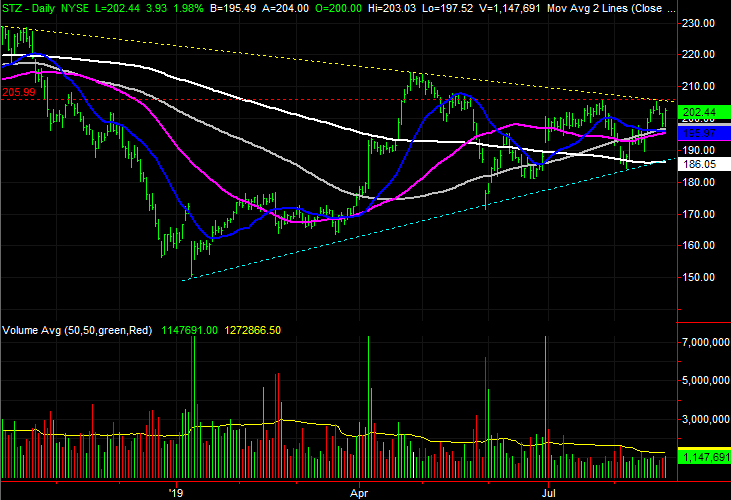
Constellation Brands shares, like most other stocks, snapped out of their late-2018 funk with a clear rebound. The effort since April, however, has been choppy at best and ineffective at worst. The end result is the formation of a converging wedge pattern that’s still got STZ stock contained.
There’s solid bullish work still being done within that containment though, that’s worth noting because it could be setting up a breakout thrust. With four months’ worth of pent-up energy ready to unleash, that move could be a very tradeworthy one.
Click to Enlarge
- The wedge is plotted on both stock charts, with the upper boundary marked by a yellow line and the lower boundary marked by a blue line. Constellation Brands is one good day away from breaking above the ceiling.
- Another technical ceiling has also taken shape since last month. STZ shares have peaked twice around $206, marked in red on both stock charts.
- We’ve not seen it happen yet, but for any breakout to be truly healthy, support has to start materializing at one or more of the moving average lines. Most are right around $196 now.
Vertex Pharmaceuticals (VRTX)
The past several months haven’t been easy ones for Vertex Pharmaceuticals shareholders. The stock has gone nowhere, but it has still been sea-sickeningly volatile. A key support as well as a key resistance line have both been breached, but in both cases, it’s only temporarily.
These past few months haven’t been pointless though. They’ve helped define how and where traders are drawing their mental lines in the sand. And, with one more good “oomph” to get VRTX shares above the ceiling — the stock couldn’t hold above earlier in the month — shares could finally breakout out of their rut.

Click to Enlarge
- It’s plotted on both stock charts. That is, Vertex shares have been squeezed toward the tip of a converging wedge shape that materialized at the beginning of this year.
- The upper boundary, marked in yellow, failed to keep the rally effort in check earlier this month, though VRTX fell back under it last week. A second wind, however, could get and keep it above that ceiling.
- It would be easy to miss given the sheer number of moving average crosses since late last year, but as of last week, we’re now in the shadow of a so-called golden cross, where the purple 50-day line is above the white 200-day line.
TechnipFMC PLC (FTI)
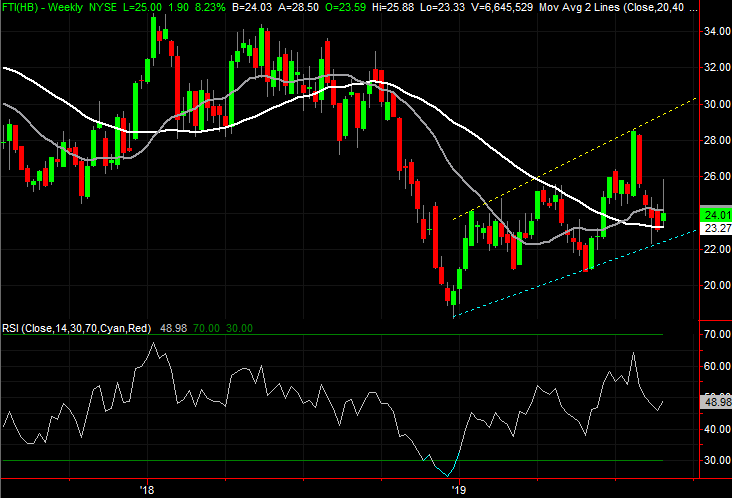
Even though it’s an S&P 500 component, most investors have likely never heard of TechnipFMC PLC. Don’t let its obscurity or relatively small size mislead you though. Even with a market cap of a modest $10 billion, the oil and gas technology stock can move and shake things up within the industry. And, like most other energy names, FTI was hit pretty hard in the last quarter of last year.
Things have been different this year though … not necessarily for the better, but moving in that direction. Even though the bulk of Monday’s intraday gain was given back, the bulls once again tipped their hand to say they’re increasingly interested in owning this name.
Click to Enlarge
As of this writing, James Brumley did not hold a position in any of the aforementioned securities. You can learn more about him at his website jamesbrumley.com, or follow him on Twitter, at @jbrumley.