Despite the lackluster start to Monday’s action, the bulls staged a respectable recovery effort. By the time yesterday’s closing bell rang, however, those buyers were backing down. The S&P 500 essentially broke even in yesterday’s session.

Overstock.com (NASDAQ:OSTK) is arguably the reason stocks couldn’t log a gain on Monday. Although not a particularly large company, the particularly large loss of 25% it booked yesterday still proved to be dead weight. The announcement of a new CEO and his subsequent contraction of the company’s EBITDA guidance rattled investors. At the other end of the spectrum, Advanced Micro Devices (NASDAQ:AMD) rallied 2%. With considerably more decliners than advancers though, that move just wasn’t enough.
Headed into Tuesday’s session, it’s the stock charts of Gilead Sciences (NASDAQ:GILD), Jefferies Financial Group (NYSE:JEF) and Baker Hughes a GE Co. (NYSE:BHGE) that deserve a more detailed inspection. Here’s what’s most noteworthy.
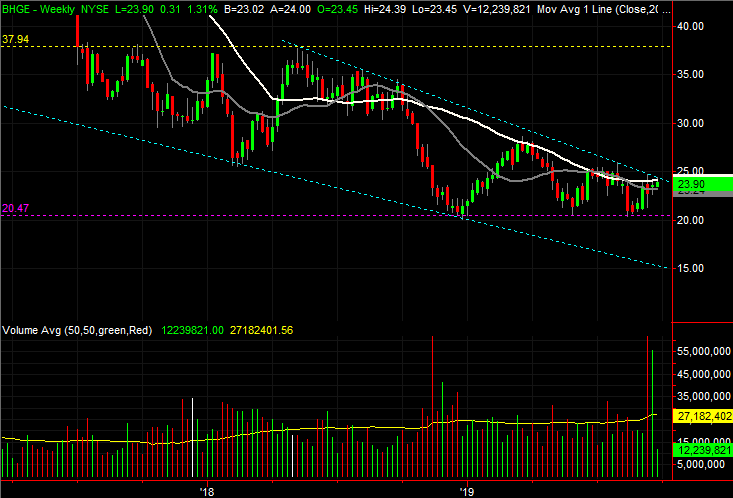
Baker Hughes a GE Co. (BHGE)
All oil and gas stocks are tricky to trade, impacted not just by demand for fuel, but impacted by changes in supply as well. Throw on the political aspects of crude pricing, and anything goes.
Still, energy stock charts are subject to the same interpretations other charts are. That’s also true of Baker Hughes, and even at a time when its partial-parent company General Electric (NYSE:GE) is severing its relationship with the oil and gas player. It’s that event, in fact, that’s driving the finality of an event that has been taking shape for some time now.
Click to Enlarge
Gilead Sciences (GILD)
Gilead Sciences has been off and on our trading radar for months now. Just when it looks like it’s going to break out, it falters. But, just when it looks like it’s going to break down, it rebounds. The end results is a range-bound chart … a range that’s narrowing.
GILD stock, however, continues to inch closer to a breakout by virtue of (once again) testing the upper boundary of that narrowing trading range. Although still not over the hurdle, another test is coming this week. That test has something of a bullish edge.
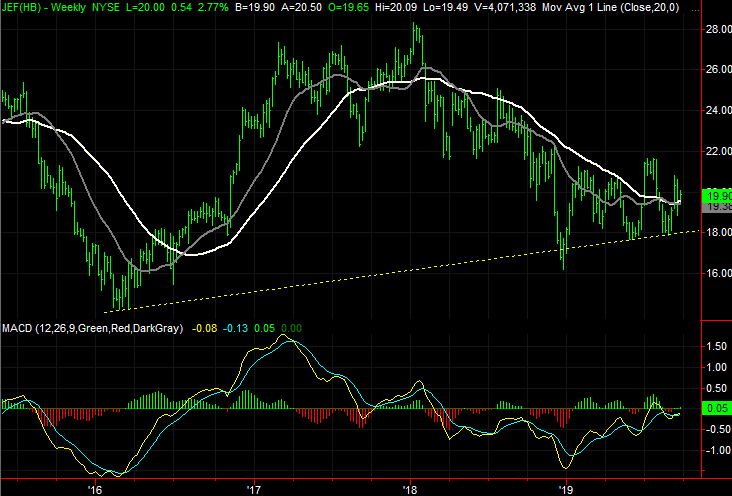
Jefferies Financial Group (JEF)
Contrary to the common assumption, a reversal of a stock chart isn’t necessarily a singular even. Sometimes it’s a process that can take shape over time, and requires several repeated efforts to shrug off the old trend and start a new one.
That may be what’s happening with Jefferies Financial Group shares right now. Last year’s bearishness hasn’t been perfectly and completely supplanted by new bullishness. But, the wide swings are now starting to force some higher highs and higher lows. It has also started to happen with decided support that bodes well from here.
Click to Enlarge
As of this writing, James Brumley did not hold a position in any of the aforementioned securities. You can learn more about him at his website jamesbrumley.com, or follow him on Twitter, at @jbrumley.