Thursday may have been a huge victory for the market, carrying stocks to a record-high close. Friday’s lack of follow-through is suspicious though.
Maybe it was just a pre-weekend cleanout, caused more by people cutting out early from work (and trading) to get a start on what should be a nice weekend. But, considering that all the FANG stocks lost ground in addition to the fact that selling volume was much greater than Friday’s buying volume, it wouldn’t be wrong to be concerned.
That said, it was Micron Technology (NASDAQ:MU) and General Electric (NYSE:GE) that actually dished out the most pain to most people. Micron fell nearly 3% on growing concerns about weakening memory prices, and GE ended the day in the red by 2.3% when it disclosed that the recently-announced flaw in its natural gas turbines may be wider-spread than first thought.
At the other end of the spectrum, AT&T (NYSE:T) mustered a 1% gain after UBS upgraded it to a “buy.” None of those names are great-looking trades as the new trading week gets started though. Rather, stock charts of Apple (NASDAQ:AAPL), Marathon Oil (NYSE:MRO) and BorgWarner (NYSE:BWA
) deserve the second, closer looks.
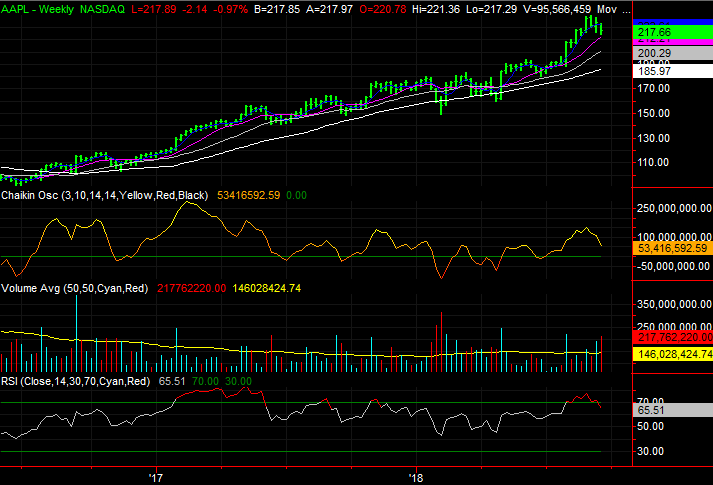
Apple (AAPL)

It’s always difficult, and even a little dangerous, to bet against not only the world’s biggest company but also the world’s most profitable company. And, perhaps Apple shares may not fall into the trap that appears to be set for it.
On the other hand, a pair of market axioms came to the forefront in response to Friday’s trading action in AAPL. The first one was the idea of buying the rumor but selling the news. The other is, don’t fight the tape.
Click to Enlarge
• Interestingly, and alarmingly, it was the unveiling of the new iPhone lineup that largely started the foreboding weakness. Friday’s huge selling volume is a red flag that a whole lot of people or a major institution are testing the waters for a buying market, perhaps looking to get out.
• The $216.10 level is the last-ditch support line, marked on the daily chart. That’s more or less where AAPL made lows for the better part of last week, but as of the end of last week the blue 20-day moving average line is acting as a ceiling.
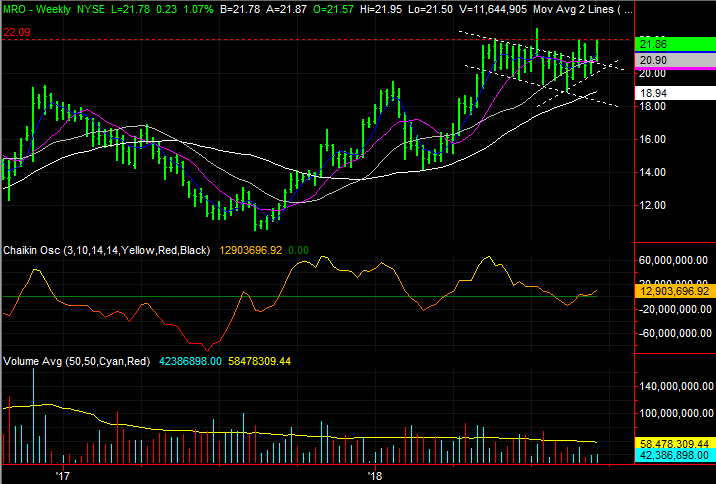
Marathon Oil (MRO)
It’s likely got more to do with the price of oil than the value of the company’s stock (though the two go hand-in-hand). But, either way, Marathon Oil shares have slowly but surely been working on setting up a breakout thrust. Friday’s close brings it to within striking distance of such a move.
Click to Enlarge
• Something significant changed on August. That is, for the first time since May, Marathon stock stopped making lower lows and starting making higher lows, leading shares to a place where the bulls and the bears have to make a decision.
• What’s missing here so far is volume. Though the weekly chart’s Chaikin line has crossed back above the zero level, there’s still only thin buying volume on the daily chart. If MRO can break above $22.11, that needed volume might start to materialize.
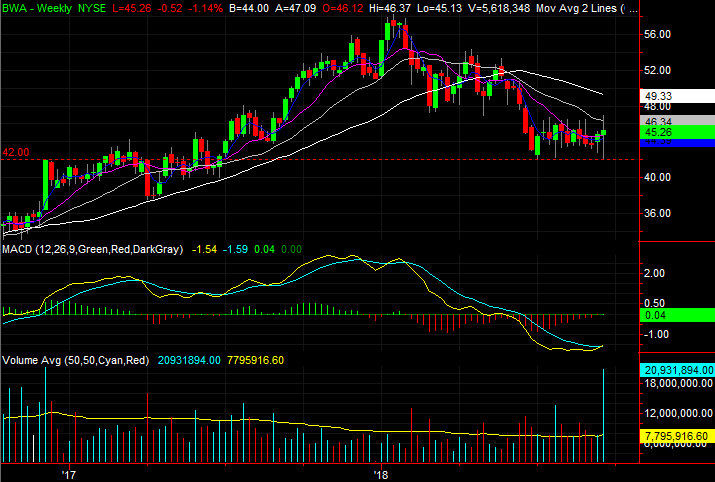
BorgWarner (BWA)
Last but not least, last Wednesday BorgWarner was examined in detail primarily because the prior day’s plunge left it hanging by a thread above a major technical floor.
That potential meltdown never took shape. In fact, that day, BWA pushed up and off that floor, hinting that a rebound rally was underway. That rally was quelled rather quickly though, at a well-established technical ceiling. Though annoying, the surprise bounce and equally surprising stalled rally effort tell us a great deal about where this stock’s limits are.
Click to Enlarge
• Take note of how little bullish volume was seen on Wednesday compared to Tuesday’s selloff. Also notice how there was even less volume with Thursday’s gain, but how the selling volume surged again with Friday’s pullback. There still seem to be more sellers than buyers.
• Don’t jump to conclusions, though. This stock is still closer to a breakout than a breakdown. The advantage of framing the sideways channel is that, if and when BWA finally breaks out of this rut, the move should be a strong one that makes up for lost time.
As of this writing, James Brumley held a long position in AT&T. You can follow him on Twitter, at @jbrumley.