The market started Friday out on the right foot, looking like it was going to follow through on Thursday’s reversal effort and rekindle the bigger uptrend. By the time Friday’s closing bell rang, though, stocks were fighting for their lives, lucky to end the session in the black. Plenty of big names did end up finishing the day in the red, led by Bank of America (NYSE:BAC) and Ford (NYSE:F).
That weakness doesn’t necessarily have to mean all worthy trades are bearish ones though. As always, swing trades are taken on a case-by-case basis.
To that end, Exxon Mobil (NYSE:XOM), Verizon Communications (NYSE:VZ) and Illinois Tool Works (NYSE:ITW) are shaping up as your best trading bets right now.
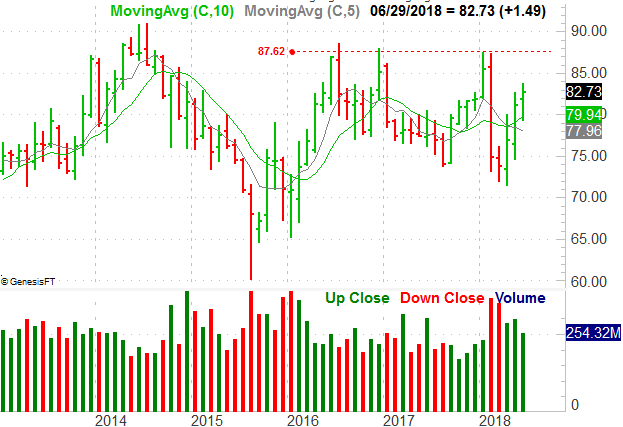
Exxon Mobil (XOM)

It has got more to do with the recovery in oil prices than with Exxon Mobil itself. But, even to the extent it can be company-specific, XOM shares are moving their way into full-blown breakout mode.
The move will rely on firm oil prices going forward, but oil prices do indeed look poised to hold up, with the stockpiled supply thinning out and OPEC keeping a relative lid on output.
Click to Enlarge
• The advance, which extends back to April, is framed nicely by rising support and resistance lines.
• While the bullishness is compelling, note that there could be a real test at $87.62, where the stock has peaked several times since 2016. If XOM can clear that hurdle, look for another leg higher, as years’ worth of improvements and cost-cutting start to pan out.
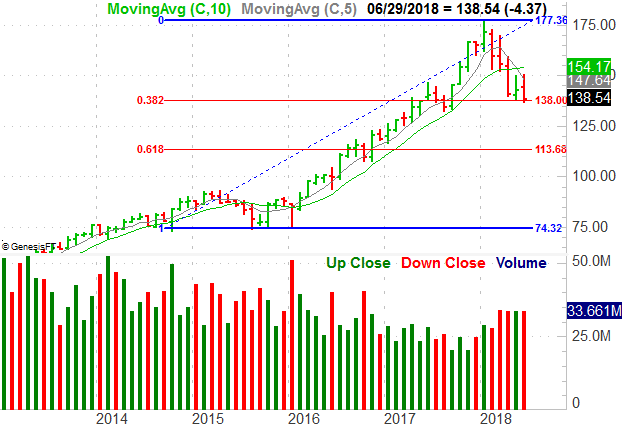
Illinois Tool Works (ITW)
Illinois Tool Works isn’t a bad company. It’s turning a profit, and higher revenues are expected to lead to earnings growth this year and next.
The stock, however, is trapped in a downtrend that has become self-sustaining; the more it falls, the more people want to dump it, which makes more people want to get it, which fans more selling flames… you get the idea.
Click to Enlarge
• The so-called “death cross,” where the 50-day moving average line crosses under the 200-day line as a sign that a trend has firmed up, happened in May, and still widening that divergence.
• The monthly chart’s Fibonacci retracement lines are apt to come into play. In fact, they already have. Using the 2015/2016 low of around $74.30, Friday’s close of $138 is a near-perfect 38.2% pullback of that advance. The bulls could draw a line in the sand there. If not though, the next-best plausible floor may well be the 61.8% retracement level of $113.70.
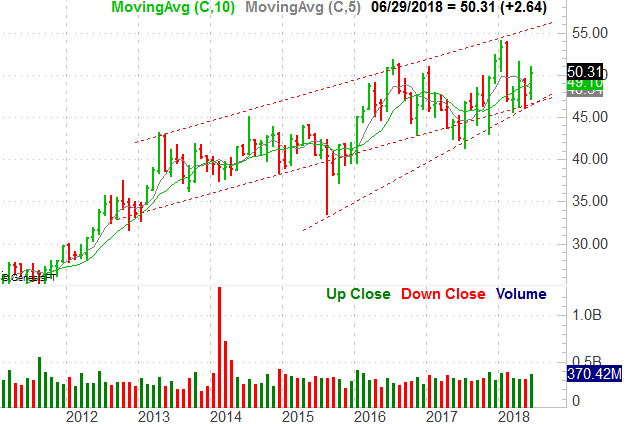
Verizon (VZ)
Most of the time, Verizon Communications and AT&T (NYSE:T) trade in tandem. For the last several months though — even before AT&T’s effort to acquire Time Warner started to gel — we’ve seen a strange divergence. While T shares have lagged, as the stock charts of VZ below will show, it has been rewarding (even if inconsistently).
Click to Enlarge
• More recently, the 50-day moving average line has crossed above the 200-day line (see the daily chart above), averting a “death cross” of its own from April.
• Be prepared for lots of back-and-forth here, meaning though the undertow is bullish and accelerating, it’s not doing so in a perfect straight line. We may need to get comfortable with the idea that VZ shares have to take one step back before taking two steps forward.
As of this writing, James Brumley did not hold a position in any of the aforementioned securities. You can follow him on Twitter, at @jbrumley.
Legendary Investor Louis Navellier’s Trading Breakthrough
Discovered almost by accident, Louis Navellier’s incredible trading breakthrough has delivered 148 double- and triple-digit winners over the last 5 years — including a stunning 487% win in just 10 months.
Learn to use this formula and you can start turning every $10,000 invested into as much as $58,700.
Click here to review Louis’ urgent presentation.