Without any major earnings news to prod it and against a backdrop of potential political turmoil that keeps a fair number of traders sidelined, the market is getting very, very sleepy. Never even mind the seasonal slowdown. The S&P 500 closed 0.17% lower on Thursday on below-average volume.
It was much worse for some investors. Alibaba (NASDAQ:BABA) lost 3.2% of its value after falling short of last quarter’s earnings estimates, despite soaring sales. Renewed concerns about the impact of a tariff war didn’t help. L Brands (NYSE:LB) gets the day’s dubious honor of doing the most damage to investors’ portfolios though. The parent company of Victoria’s Secret and Bath & Body Works watched its stock slide 11.4% after peeling back its full-year profit guidance.
At the other end of the spectrum, Advanced Micro Devices (NASDAQ:AMD) rallied 6.7% on Thursday, mostly in response to Rosenblatt Securities’ higher price target. The firm now says AMD is worth $30 per share.
The market’s big winners just couldn’t do enough heavy lifting though. There were almost twice as many decliners as advancers yesterday, and bullish volume was only half as strong as bearish volume, reversing trends that only started to take shape a couple of days ago.
The wishy-washy environment continues to make it tough to trade, forcing traders to look a little deeper for the right stock charts than they normally might. But, they’re there. Heading into the action on the last day of the trading week, Broadcom (NASDAQ:AVGO), Fastenal (NASDAQ:FAST) and Danaher (NYSE:DHR
) — not exactly the highest-profile names — are shaping up as your top prospects.
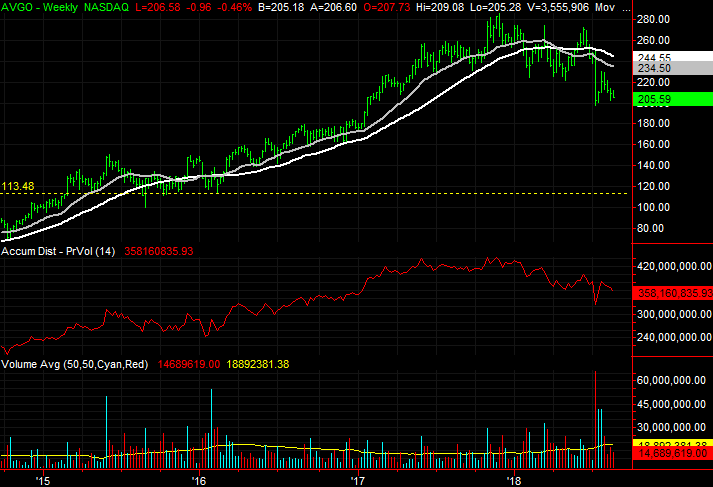
Broadcom (AVGO)

Semiconductor company Broadcom doesn’t have a valuation problem. It’s trading at a single-digit trailing P/E, and the forward-looking P/E of 10 likely underestimates how well the company will do next year. Even if the global economy stumbles into a recession, it’s not apt to be a devastating one. Broadcom may ride through the storm impressively well.
If traders have decided AVGO is simply too dangerous to own, though, then there’s little that can be done to sidestep a selloff. And, that appears to be the shape of things.
Click to Enlarge
• Although the volume that has materialized since the late July peak hasn’t matched the post-plunge rally’s bullish volume, what the selloff has lacked in volume has been offset by consistency. The daily chart’s Chaikin line just broke under the zero line, confirming the bearish volume trend has some momentum.
• It sounds outlandish (and is), but if this selling effort retains or gains more traction, there’s not another technical support level in sight until the $113 area, where Broadcom began a huge rally back in late-2015.
Fastenal (FAST)
Credit has to be given where it’s due — Fastenal has capitalized on the revitalization of the housing construction market, and the more recent revamp of the nation’s manufacturing and industrial sector. Revenue and earnings are growing, and are expected to grow again next year.
The stock’s getting uncomfortably expensive though, valued at 25 times its trailing earnings and 21 times its forward-looking profits. That, coupled with the recent bump into a long-standing resistance level, sets the stage for a wave of profit-taking that will unwind much of the 27% gain reaped since early July.

Click to Enlarge
• The pattern of pullbacks after this overbought condition has been reached is quite reliable. The RSI and stochastic indicators both are both signaling, or are close to signaling, a pullback as they have over the course of the past couple of years.
• As was the case with all the other rallies that rolled over, this runup lacks the volume it needs. Rallies need to gather volume on the way up to be sustained.
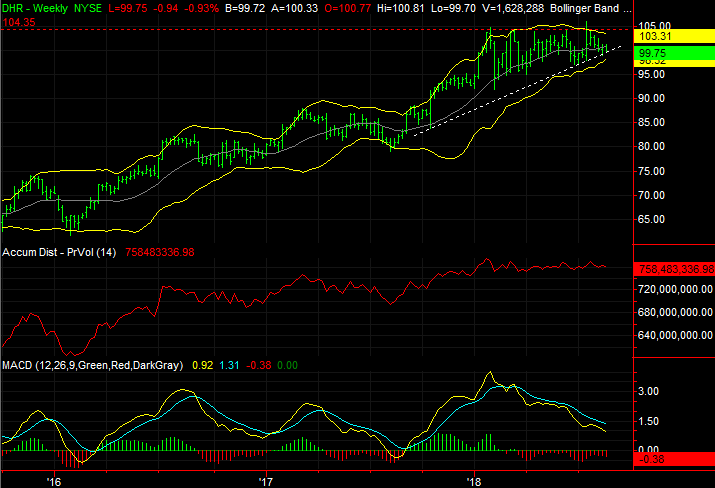
Danaher (DHR)
Finally, industrial electronics outfit Danaher looks like little more than just an erratic mess with just a quick glance. But, there may actually be a quiet method to the madness. Slowly but surely, DHR stock is approaching a key support level that, if crossed, could easily accelerate the selling effort.
Click to Enlarge
• One of these support levels — and arguably the biggest one — is the 200-day moving average line (white) at $98.71. The other is the lower Bollinger band (yellow) on the weekly chart, at $98.32. If either or both fail as a floor, there’s little else left to stop a selloff.
• If the 50-day moving average line (purple) ends up falling below the 200-day line, as it appears it will, that so-called “death cross” will only embolden any bearish undertow.
As of this writing, James Brumley did not hold a position in any of the aforementioned securities. You can follow him on Twitter, at @jbrumley.