For a fair amount of Friday’s session, it looked like stocks were going to unwind part of the shortened week’s setback. Though it would still book a loss for the week, at least it would be a tolerable one. By the time the closing bell rang, though, the S&P 500 was down another 0.22%. The close of 2,871.68 translated into the worst weekly performance for the market since March.
Leading the charge lower were Tesla (NASDAQ:TSLA) and Advanced Micro Devices (NASDAQ:AMD). Tesla shares fell more than 6% on the heels of a strange (to the point of being unhinged) podcast interview with Elon Musk, during which he appeared to be smoking marijuana. Fanning the selling flames was word that yet another executive had abruptly left. AMD, meanwhile, tumbled almost 2% mostly because traders aren’t quite sure what to make of it, but know the stock is feeling the weight of recent, huge gains.
Not every stock was backpedaling. Costco (NASDAQ:COST) advanced 2% after reporting impressive August sales. There just weren’t enough stories like Costco’s to push the broad market over the hump headed into the weekend.
It’s the kind of backdrop that can make trading tricky, in that it’s not clear which direction the undertow is actually pointed. To the extent stock charts help spot those trends though, it’s the stock charts of Apple (NASDAQ:AAPL), General Mills (NYSE:GIS) and Fastenal (NASDAQ:FAST
) that are the most promising possibilities. Here’s why.
Apple (AAPL)

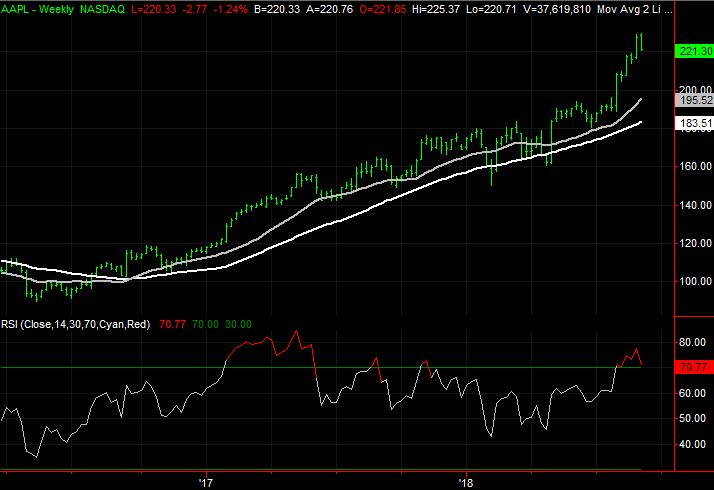
It’s difficult (and even a little dangerous) to bet against Apple. Not only is it the biggest company in the world, but it’s also the most profitable. Consumers love the brand.
Nevertheless, AAPL shares got a little ahead of themselves in August, leaving them at least a little vulnerable to profit-taking. Last week’s action suggests that may already be underway.
Click to Enlarge
• The volume for the past several days has been even more telling. The bullish volume seen during the last couple of days of August was actually falling, but the selling volume for the past three days not only started above average, but grew as the selloff took shape.
• Zooming out to a weekly chart of Apple, we can see the RSI indicator confirms an overbought condition. We can also see just how far removed the stock has gotten from its mean, or average. Now we may be due for a return to the mean, which is closer to $200.
General Mills (GIS)
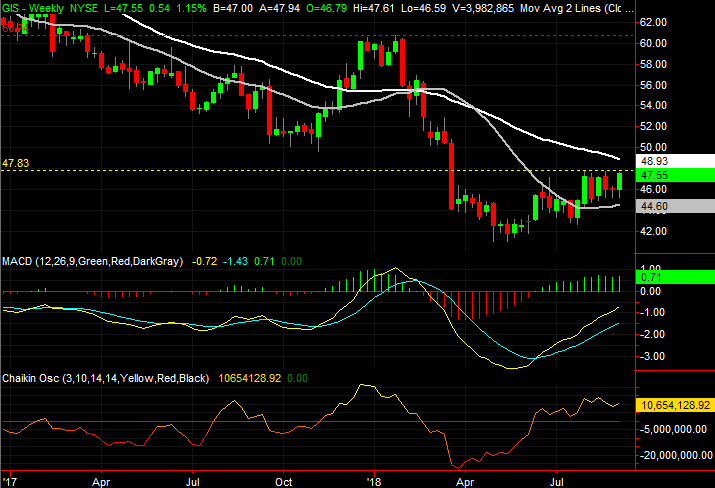
The past few weeks generally have been good ones for food companies, and General Mills hasn’t been an exception to this trend. It may be an indication that investors are slowly migrating to safer havens and reliable names as they rethink their more aggressive growth holdings, anticipating some sort of weakness.
Whatever the reason, the best may be yet to come for General Mills. GIS has not only been trending higher, but has used a key moving average as a pushoff point that’s put the stock within striking distance of a major technical ceiling.
Click to Enlarge
• There’s a big resistance line around $47.80, where General Mills shares peaked a couple of times in August. That’s also near Friday’s high. That line needs to be hurdled first before the stock can get into truly bullish groove.
• The upper boundary of the bearish gap left behind by the March plunge could be part of the bullish motivation in play here. But, if the gap is filled, it will also coincide with a cross above the 200-day moving average line (white). If that long-term moving average line is hurdled, that’s also a bullish inspiration that could help catapult the stock out of the consolidation phase it’s been in since June. Past that, the peak near $61 seen around the time 2017 was becoming 2018 is a plausible ceiling.
Fastenal (FAST)
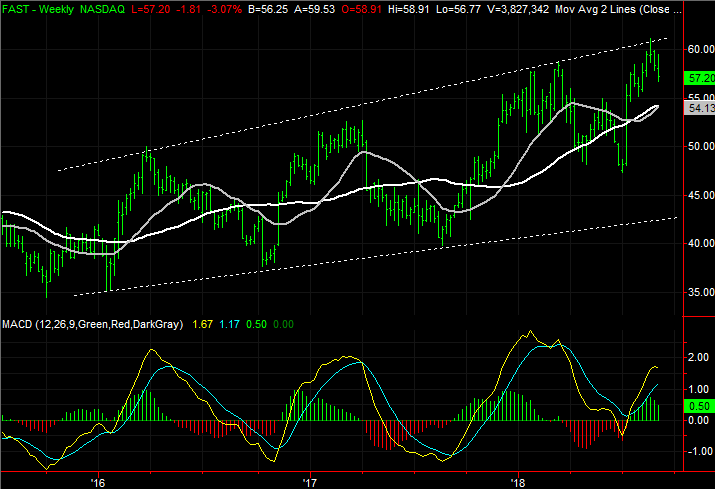
Last but not least, an updated look at Fastenal, which was one of the highlighted stock charts back on Aug. 24. At the time [see the pink arrow on the daily chart], FAST shares were rallying quite nicely, but had just bumped into a major technical ceiling that had the potential stop and reverse that trend.
That’s indeed how it happened. But, the potential weakness has only started to materialize. A great deal of untapped downside remains on the table.
Click to Enlarge
• Zooming out to the weekly chart of FAST puts the pattern in perspective. The stock has been trapped in a wide and well-defined trading range since 2016, the lower boundary of which is presently around $43. A selloff of that size seems unthinkable right now, but it wouldn’t be out of character for the stock.
As of this writing, James Brumley did not hold a position in any of the aforementioned securities. You can follow him on Twitter, at @jbrumley.