Although it got close a couple of times, the S&P 500 never tiptoed into the black on Wednesday. Neither did the Nasdaq. The blue-chip-heavy Dow Jones Industrial Average did, however. In fact, the Dow closed up to the tune of 0.09%. It’s not an earth-shattering victory, but it does suggest that investors are starting to look for safe-haven stocks. Dow names would be a good place to start.
Netflix (NASDAQ:NFLX) and Twitter (NYSE:TWTR) dished out most of the damage. NFLX shares slumped 6.2%, finally buckling under the weight of last month’s flimsy advance. TWTR stock was off 6.1%, and though much of that selling can be chalked up to the bad optics of CEO Jack Dorsey being grilled during a Congressional hearing, Twitter shares may have been destined for steep profit-taking anyway as traders flee technology stocks. The tech sector was the day’s worst-performing sector, falling 1.4%.
It wasn’t all bad news though. Advanced Micro Devices (NASDAQ:AMD) tacked on another 1.6% worth of value in response to reiterated optimism from Jefferies. It just wasn’t enough to inspire the whole market.
Headed into Thursday’s action — and with the environment is getting tricky, as Wednesday’s trading illustrates — the stock charts of Hartford Financial Services Group (NYSE:HIG), Kroger (NYSE:KR) and Prologis
(NYSE:PLD) are shaping up as the most intelligent bets.
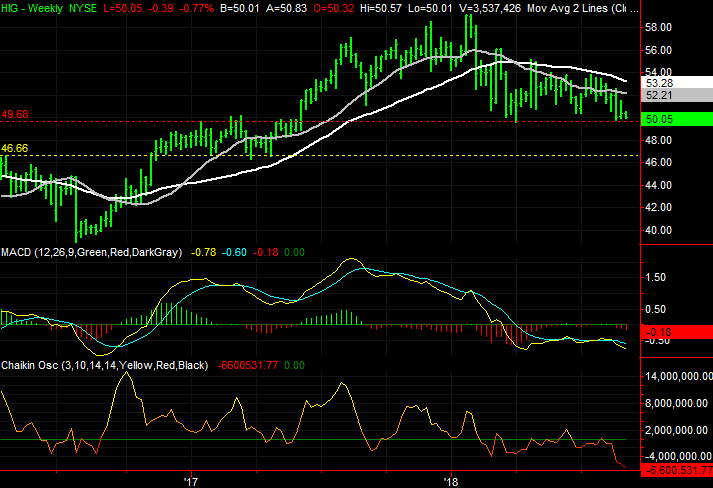
Hartford Financial Services Group (HIG)

The last few days have been tough ones for Hartford Financial Services Group shareholders, with the stock sliding 6% since mid-July.
But, things could get much worse very quickly with one or two more bad days. The stock is within sight of a major technical floor that, if broken, may open the selling floodgates.
Click to Enlarge
• The volume behind the recent weakness has already been outsized relative to the weakness seen thus far. The weekly chart’s Chaikin line is well under zero, and the daily chart’s accumulation-distribution line is plowing into multimonth lows.
• If the support at $49.72 fails to hold up, the next-most-likely technical support is $46.66, where Hartford Financial Services Group found a floor a few times in early 2017.
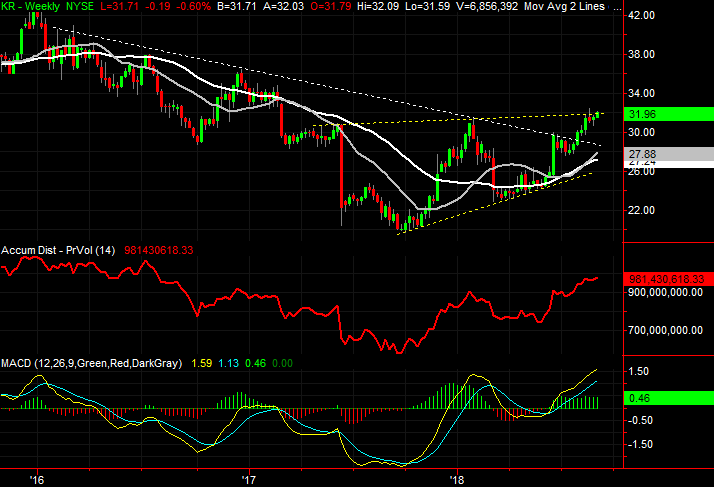
Kroger (KR)
Kroger was one of the featured stock charts back on Aug. 20. The stock caught the attention of investors as it moved within striking distance of crossing above a major technical resistance line that had the potential to act as a slingshot that might catapult KR shares higher. That didn’t happen, even though Kroger briefly edged above that ceiling briefly just a couple of days later. Shares peeled back the next day, quelling hopes for that breakout move.
Yesterday’s advance, however, puts the whole breakout premise back on the table. Kroger shares are right above that ceiling, testing the waters for a second effort.
Click to Enlarge
• Zooming out to the weekly chart of Kroger, we can see the stock has held on to a breakout thrust above a falling resistance line (white, dashed) that had been guiding the stock lower since 2016.
• Bolstering this budding momentum might be the growing (and aforementioned) search for safety that grocers can bring. Keep your finger on that pulse of the market’s psyche.
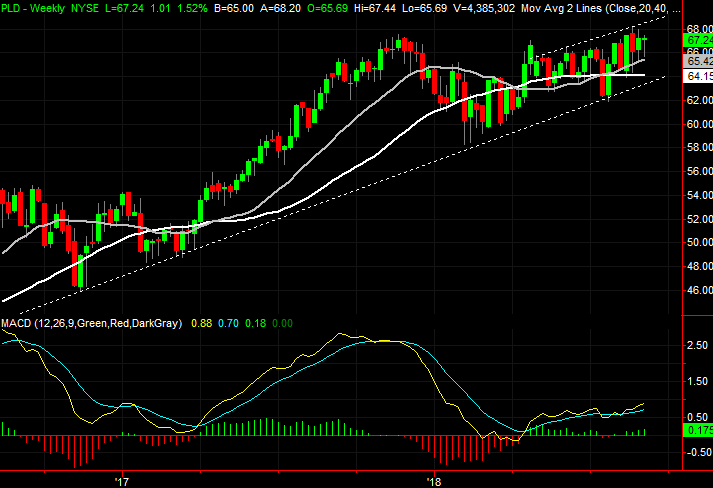
Prologis (PLD)
Last but not least, Prologis was another name we recently featured as one of the top stock charts worth a look. Namely, back on Aug. 22 it was theorized that the sharply bearish bar for that day set the stage for what was actually a major upside move that was already taking shape. It was just doing so erratically.
It didn’t happen the next day. In fact, PLD fell further the next couple of days. It is happening though, and despite the fact that choppiness still abounds, the undertow is still bullish.
Click to Enlarge
• Notice how the biggest “up” days on the daily chart all unfurled on above-average volume, while the “down” days have been taking shape on shrinking volume.
• To fully appreciate the persistence of the uptrend despite the choppiness, one has to zoom out to a weekly chart of Prologis. It’s in this timeframe, we can see PLD has only recently pushed up and off a rising support line that goes back to the late-2016 low.
As of this writing, James Brumley did not hold a position in any of the aforementioned securities. You can follow him on Twitter, at @jbrumley.