The market could have ended Tuesday’s action on either side of the fence, but when push came to shove as the closing bell approached, the big 11.5% advance from Advanced Micro Devices (NASDAQ:AMD) just wasn’t enough to offset all the other losers. Though the S&P 500 only lost 0.17% of its value yesterday, decliners outnumbered advancers by almost two-to-one.
The most notable dead weight from Tuesday was the 3.2% setback suffered by Nike (NYSE:NKE) and the 4.2% selloff from Tesla (NASDAQ:TSLA). Investors reacted poorly to news that Nike has inked a multiyear, multi-million-dollar endorsement deal with the controversial Colin Kaepernick. Tesla, meanwhile, lost ground largely on the heels of a downgrade from Goldman Sachs. The investment bank’s research arm is concerned about too much debt and too much budding competition.
None of those companies’ stock charts are well suited for trading today though; they’re little more than a coin toss. Rather, it’s stock charts of FMC (NYSE:FMC), Hewlett Packard Enterprise (NYSE:HPE) and Eli Lilly (NYSE:LLY
) that have — or are close to — reliably trade-worthy movers.
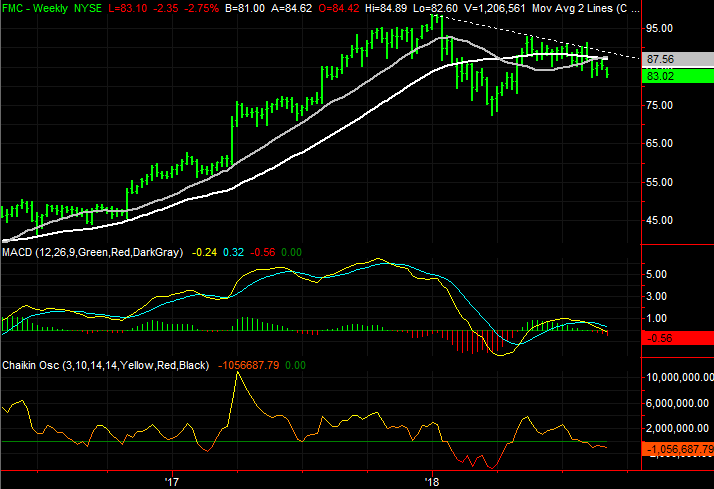
FMC (FMC)

If FMC rings vaguely familiar, it may be because it was one of the featured stock charts from almost a month ago. At the time, the stock was in a modest but persistent downtrend, but had yet to break below a major support level.
It broke under that floor in the meantime. In fact, it broke back under it twice as of yesterday’s 2.8% tumble … a breakdown that was made even more troubling after the stock failed to make good on a breakout/rebound effort just a few days after our early August look.
Click to Enlarge
• The volume behind the recent bearish days of late has been decidedly greater than the volume on the few bullish days we’ve seen since May, leading to bearish volume-based sell signals on both stock charts in view.
• It’s possible — maybe even likely — FMC will bounce a bit after Tuesday’s stumble, as was the case a couple of times in the middle of last month. Given how much damage has already been done, though, and how much ground there is to give up from 2017’s runup, the scales are already tilted in the wrong direction.
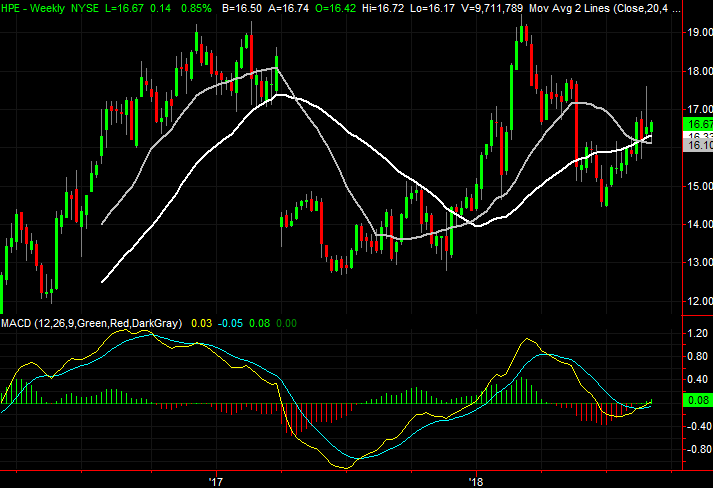
Hewlett Packard Enterprise (HPE)
Like it or not, the global economy is in growth mode, prompting companies to make equipment and technology purchases they’ve been putting off for too long. The advent of the cloud has further inspired this spending ramp-up. The market has been particularly resistant to Hewlett Packard Enterprise in this regard, keeping shares of HPE in check despite a ridiculous trailing P/E of 8.3 and a forward-looking P/E of 10.6 that arguably underestimates how well the computer and printer company can do.
It’s largely becoming unavoidable, however, that the rising tide is lifting all boats, and that HPE has a reserved seat. This serves as the underpinnings for an increasingly strong bullish effort from the chart of Hewlett Packard Enterprise.
Click to Enlarge
• The weekly chart shows us a new bullish MACD divergence while at the same time clearly signaling that HPE shares are still well below peak pricing near $19, from March.
• One more bullish follow-through day, particularly on high volume, would serve as much-needed confirmation that the undertow has shifted in a bullish direction.
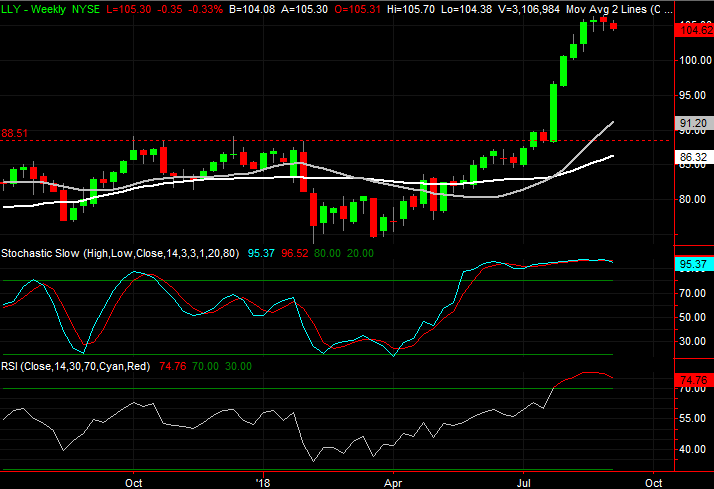
Eli Lilly (LLY)
Last but not least, up 40% from March’s lows, Eli Lilly has become one of 2018’s surprising heroes.
That rally has completely stalled though, and is now teetering on the brink of collapse. One small step in the wrong direction has the potential to set off of a wave of profit-taking.
Click to Enlarge
• We can’t chalk this pause up to just a mere coincidence or the calendar either. Even on the way up beginning in late July, the amount of daily bullish volume has been waning the whole time. There aren’t as many believers in the rally as the price of Eli Lilly shares alone would suggest.
• If the floor at $104.20 snaps, the most plausible floor from there is somewhere around $88.50. LLY has found support and resistance there within the past few months. There’s also a gap near there, from late July, the bears may try to backfill.
As of this writing, James Brumley did not hold a position in any of the aforementioned securities. You can follow him on Twitter, at @jbrumley.