Whoops. For no particular reason other than the sheer weight of recent gains and the lack of justification for them, the sellers hit stocks harder on Thursday than they had in weeks. The S&P 500 ended the day down 0.82%, which was better than its intraday loss, but still below some key support levels.
The highly followed Advanced Micro Devices (NASDAQ:AMD) took a sizeable toll, not only falling 2.3%, but certainly inspiring the selling of other important technology names. Bank of America (NYSE:BAC) was up 1.4%, bouncing back with other banks, but their collective gains still weren’t enough to drag the broad market back into the black.
Those aren’t the names traders will want to take a closer look at today, however. Rather, stocks charts of Macy’s (NYSE:M), PPL (NYSE:PPL) and Eli Lilly (NYSE:LLY) are most worthy of inspection. Here’s why.
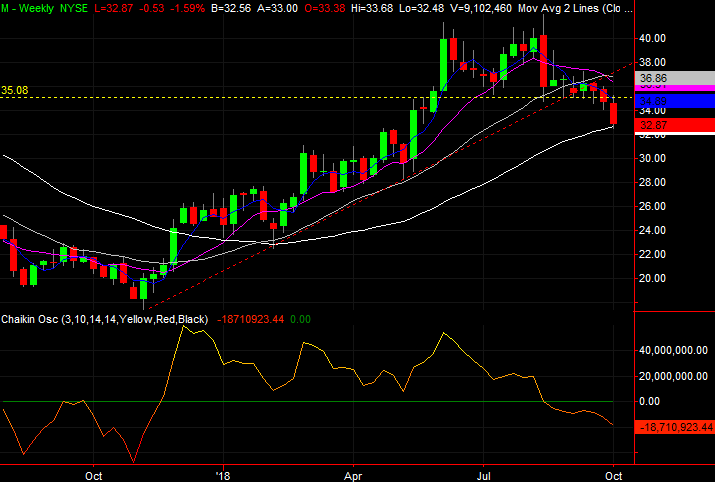
Macy’s (M)

Macy’s should ring a bell. It was one of the stock charts we put under the microscope back on Sept. 25, shortly after a key support line had turned into a resistance line. It appeared to be a setup for a bearish leg.
That concern was valid. With one last failed attempt to crawl back above that hurdle, the would-be buyers finally threw in the towel. The tumble in the meantime has carried M shares down to another pivotal line in the sand that, if broken, opens the door to another wave of selling.
Click to Enlarge
• Should the 200-day average line fail as a floor, the next potential support level is around $30, which is the bottom of the bullish gap left behind by May’s surge.
• That being said, don’t get presumptuous here. Though the stock is performing poorly, there has not been a great deal of volume behind the selling effort thus far.
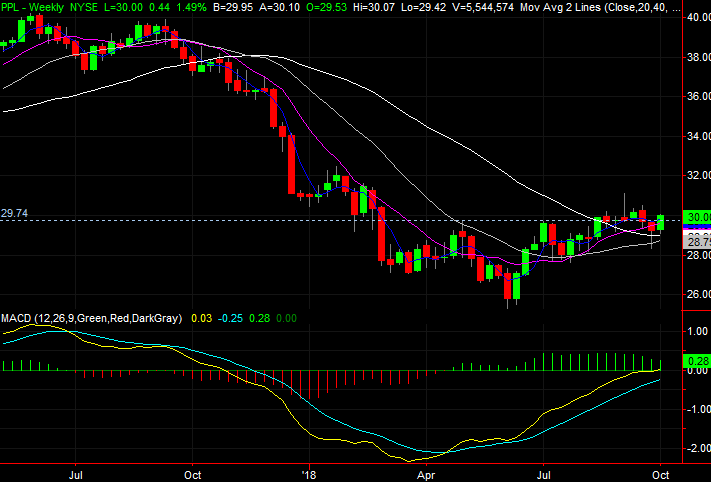
PPL (PPL)
PPL is another name that has been scrutinized of late. The last look was from Aug. 14, when the stock looked poise to break above a technical ceiling as part of a long-term recovery effort.
That happened, but the move didn’t stick. In fact, by a month later, PPL was right back where it started. The rebound effort has picked up again, though, and this time it’s getting going on an even firmer footing.
Click to Enlarge
• Zooming out to the weekly chart puts things in perspective. The bears arguably got overzealous with PPL last year, leaving plenty of room for recovery now.
• Much of this renewed strength has more to do with a flight to safety than PPL specifically. The company is a utility name, which is about as safe as it gets. The reasoning, however, is irrelevant in the short run.
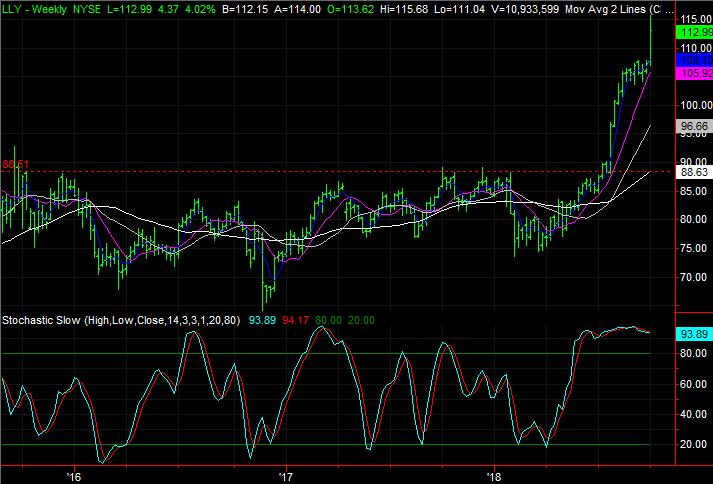
Eli Lilly (LLY)
Finally, as the old adage goes, too much of anything is still too much. It’s true in trading, which is why the oddly bullish runup from Eli Lilly since July followed by Thursday’s gap-making 4% gain may also mark the pivot from a rally into a pullback.
Click to Enlarge
• The volume surge is also alarming, as such surges also tend to mark turning points for a trend.
• Nevertheless, this is still a possibility that needs lots of confirmation. It will start with a decided downside move, but the clincher won’t take shape until LLY shares break below a major support area around $104 where a couple of support levels have converged.
As of this writing, James Brumley did not hold a position in any of the aforementioned securities. You can follow him on Twitter, at @jbrumley.