It could have been worse. Though the S&P 500 ended the day at 2,919.37 on Monday, down 0.35%, at one point in the middle of the session the index was off by as much as 0.58%.
Either way, more than a few of the market’s key names struggled yesterday. General Electric (NYSE:GE) fell 3.5% as design problems with its natural gas turbines continue to weigh on investors’ minds. Meanwhile, Comcast (NASDAQ:CMCSA) ended the day down 6% after winning what turned out to be an expensive bidding war for Europe’s pay-TV outfit Sky. Advanced Micro Devices (NASDAQ:AMD) advanced 5% on fresh optimism from Jefferies. It just wasn’t enough. Decliners outpaced advancers by almost two-to-one, and there was 30% more bearish volume than bullish volume.
Headed into Tuesday’s trading, stock charts of IHS Markit (NASDAQ:INFO), Prologis (NYSE:PLD) and Macy’s (NYSE:M
) are the most compelling prospects simply because they appear to be doing their own thing and are un-swayed by the erratic market.
IHS Markit (INFO)

IHS Markit shares aren’t past the proverbial point of no return yet, but with Monday’s 1.7% setback in the rearview mirror, the stock’s just one bad day away from starting to unravel.
And, it’s history shows that once unwinding of an overbought condition starts, it doesn’t stop.

Click to Enlarge
• The weekly chart of INFO puts things in perspective. This isn’t a name that readily gets into and stays in an overbought condition.
• Notice also in the weekly timeframe that the 200-day moving average line, currently around $50.00 and plotted with a solid white line on both stock charts, doesn’t necessarily keep the selling effort in check.
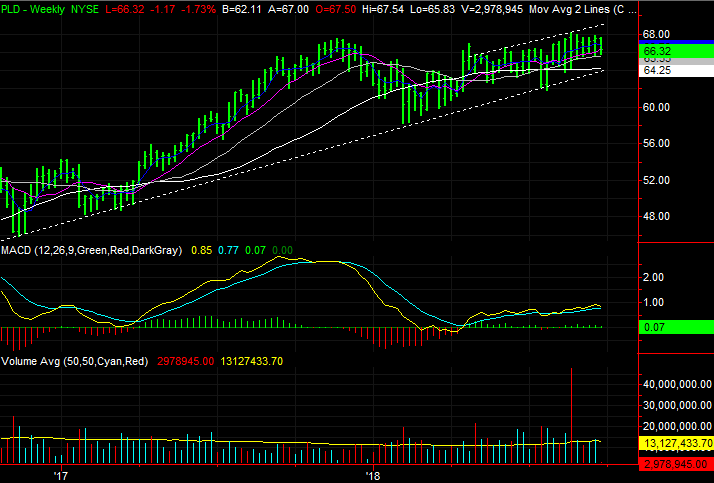
Prologis (PLD)
If the name Prologis rings a bell, that may be because it was one of the three stock charts put in focus back on Aug. 22, and then again on Sept. 6. Both times the message was the same. That is, though very choppy from day to day, it was slowly but surely making forward progress.
That progress is not only now more evident, PLD is close to moving above yet another technical ceiling that will “reset” its trading range.
Click to Enlarge
• Taking a step back and looking at the weekly chart we can see the broad uptrend that’s been in place since late-2016. It’s foundation is a support line that tags all the major lows going back that far, with a white dashed line.
• Although choppy now, the more forward progress PLD makes, the more likely it becomes that the sidelined would-be buyers start to flow in and make a more consistent rally effort.
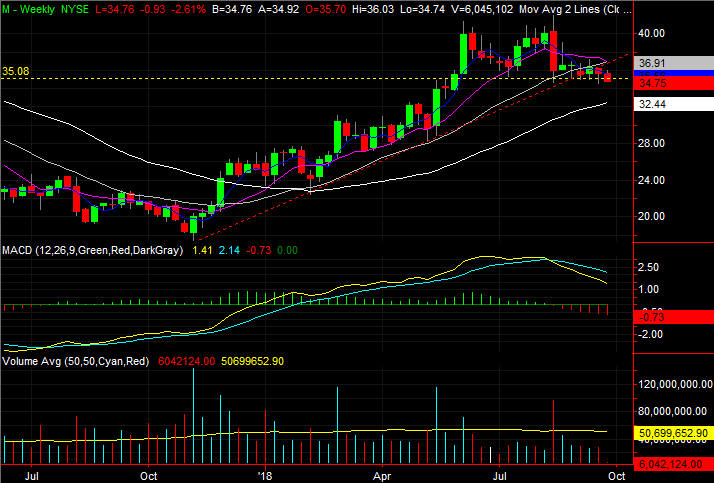
Macy’s (M)
Finally, Macy’s is another name we’ve dissected a couple of times of late. The most recent look at M was a week ago, when we pointed out the stock was putting serious pressure on a support level of $35.02.
It didn’t happen right away, but it finally happened on Monday. Now that the floor’s been snapped, it’s going to be much easier for the bears to dig in and do some damage to this vulnerable name.
Click to Enlarge
• It’s likely the big bullish gap from May, starting near $30, is the target the sellers are gunning for. The market generally doesn’t like to leave gaps unfilled, although it’s not a hard-and-fast rule. But, filling in that gap would also drag M below its white 200-day moving average line, which is a selling catalyst in and of itself.
• In the weekly timeframe, we can see Macy’s stock has long since broken below the rising support line, plotted as a red dashed line, that’s been guiding it higher since late last year.
As of this writing, James Brumley did not hold a position in any of the aforementioned securities. You can follow him on Twitter, at @jbrumley.