
Ugh, it was a tough day for the bulls on Wall Street. While the market’s major indices are still far from bear country, it’s been a tough few days. The Dow fell 700 points, while the S&P 500 and Nasdaq each fell about 2.5%. Let’s look at some must-see stock charts as a result.
Must-See Stock Charts #1: Dow Jones Industrial Average
Click to Enlarge
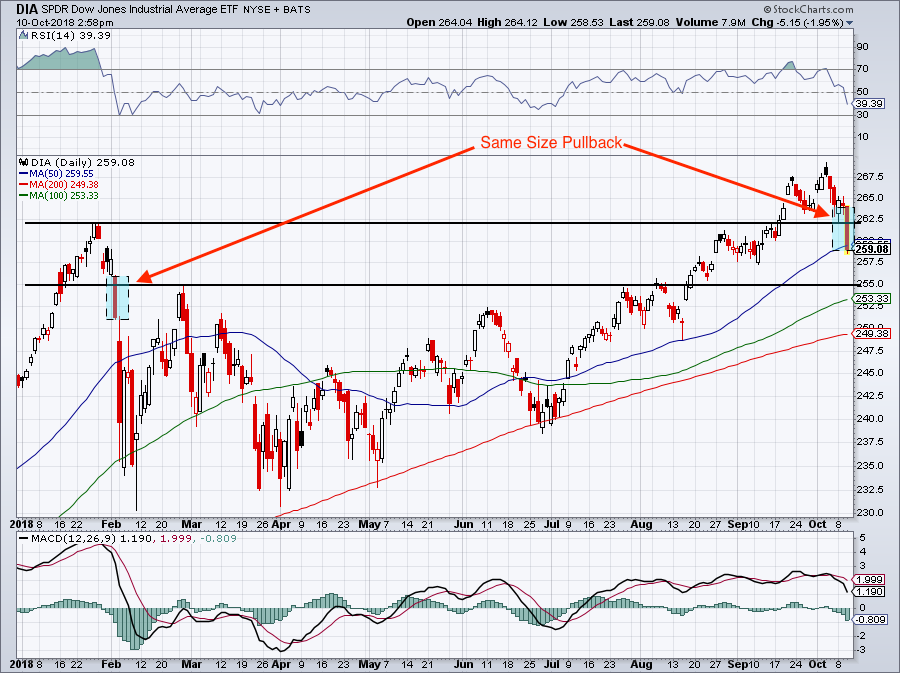
For simplicity, let’s use the SPDR Dow Jones Industrial Average ETF (NYSEARCA:DIA), which fell 2.8% Wednesday.
The DIA knifed through the January highs. I’m not trying to be a fear monger here, but I want to point out that, just because the Dow’s down 700 points, doesn’t mean it’s at a bottom. The blue box on the left in February is the same size as the one from Wednesday session.
In February we had the implosion of several volatility-related instruments, which is not the case this time around. Short of an explosion higher in bond yields, I don’t expect a repeat of February.
For the DIA, I would love for a pullback to the $255 area. We’ll run into a big prior resistance level and have the 100-day moving average just below at $253.50. That will at least give us a defined risk/reward.
Must-See Stock Charts #2: The VIX
Click to Enlarge
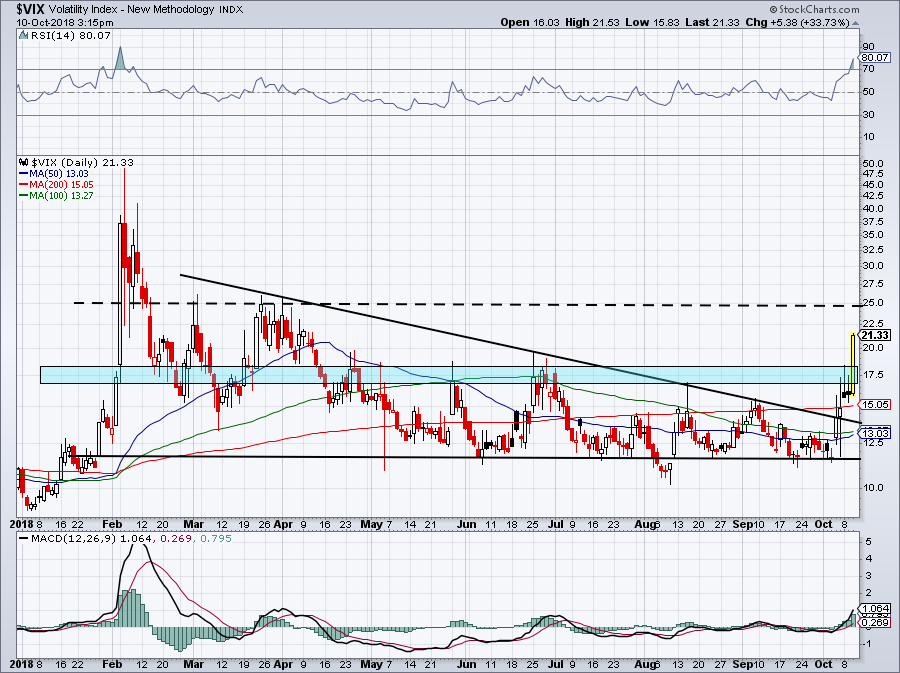
Often known as the “fear gauge,” the CBOE Volatility Index (INDEXCBOE:VIX) is bursting on Wednesday.
After bumping up against the $17.50 level for a few sessions, the VIX exploded 35% on Wednesday and climbed above $21. Now here’s where the party starts. Should the VIX trade in the low-$20s for a few days, it will remain a bumpy and turbulent ride for traders.
Over $25 though and it will get downright scary. But note that over the past year the VIX hasn’t been able to sustain above this level. Sure it popped above it a few times, but ultimately it wasn’t able to hold up over it. The only time it did? February.
But if we get a run over $40, know that it’s unsustainable. Particularly in this environment.
Must-See Stock Charts #3: Nasdaq
Click to Enlarge
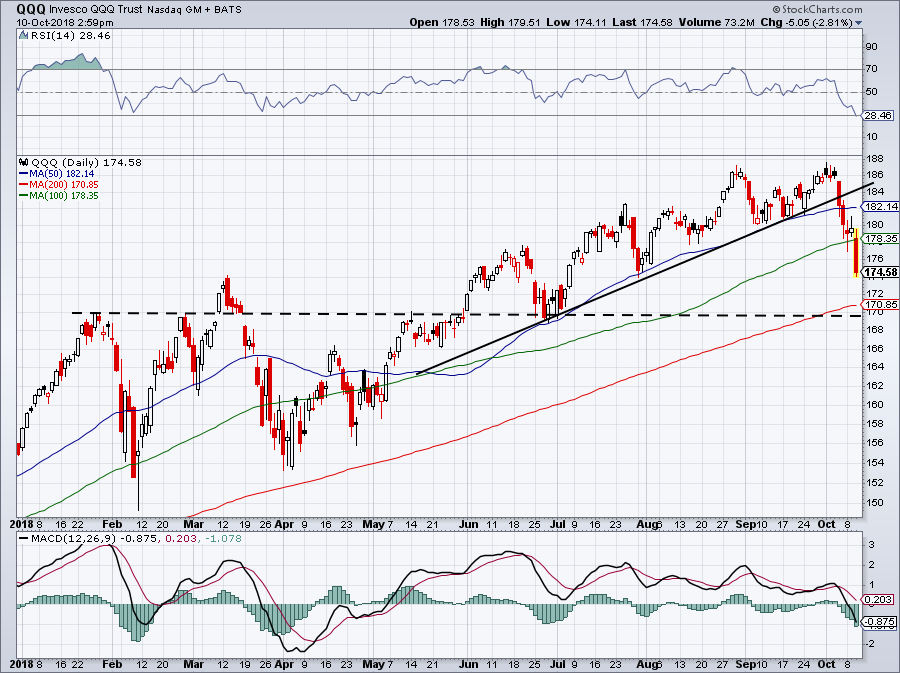
The Nasdaq was the hardest hit index of the three major indices Wednesday. Like the Dow, we’ll use the PowerShares QQQ ETF (NASDAQ:QQQ) for simplicity, which fell almost 4% on the day.
After holding up nicely near the 100-day moving average, the QQQ dumped below it Wednesday. Similar to the Dow, I would like to see a pullback to that last big resistance area. In this case, it’s near $170 for the QQQ.
Getting there would require breaking below the 200-day moving average, which is less than $1 above our target. In any regard, it will require another 2% to 2.5% pullback. It could give us a good buying opportunity in names like Apple (NASDAQ:AAPL), Amazon (NASDAQ:AMZN
), Alphabet (NASDAQ:GOOGL), Adobe (NASDAQ:ADBE), Salesforce (NYSE:CRM) and others.
Must-See Stock Charts #4: Walmart
Click to Enlarge
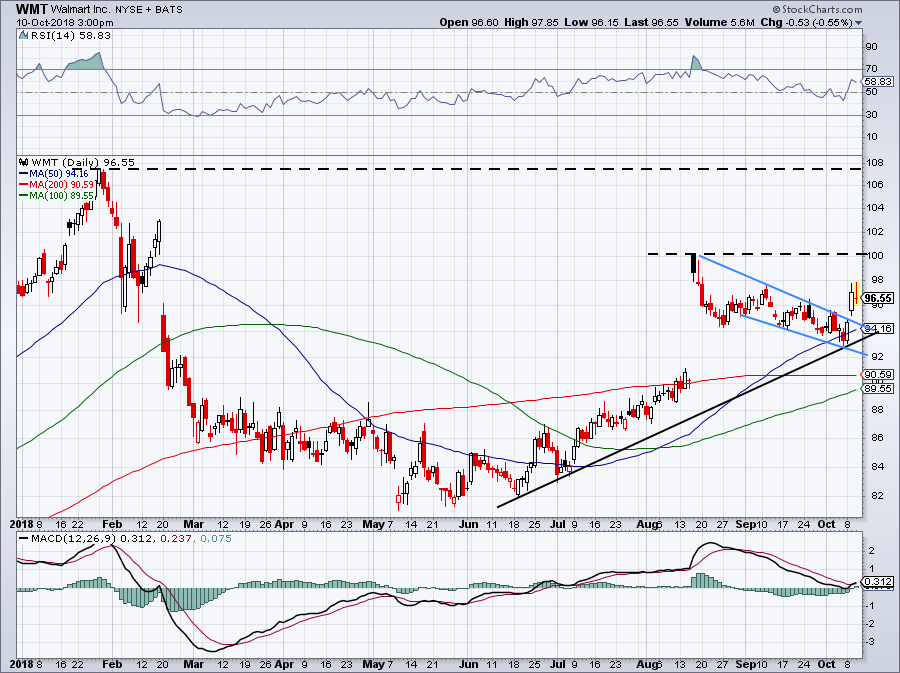
Let’s look at some individual names. Overall, dividend stocks, REITs and blue-chip names are holding up best. Walmart (NYSE:WMT) is among that group.
Earlier this week we took a closer look at WMT stock, deciding whether to buy ahead of the holidays or to pass. Specifically, we noted the downward channel it was in (blue lines) and said a breakout from this trend would be a buy.
Now that it has, investors can hide out in this name. Below $93 and I would likely stop-out of WMT. But if the markets can recover, $100 then $108 is technically possible. Over the 50-day, downtrend resistance (blue line) and uptrend support (black line) makes WMT one to hold.
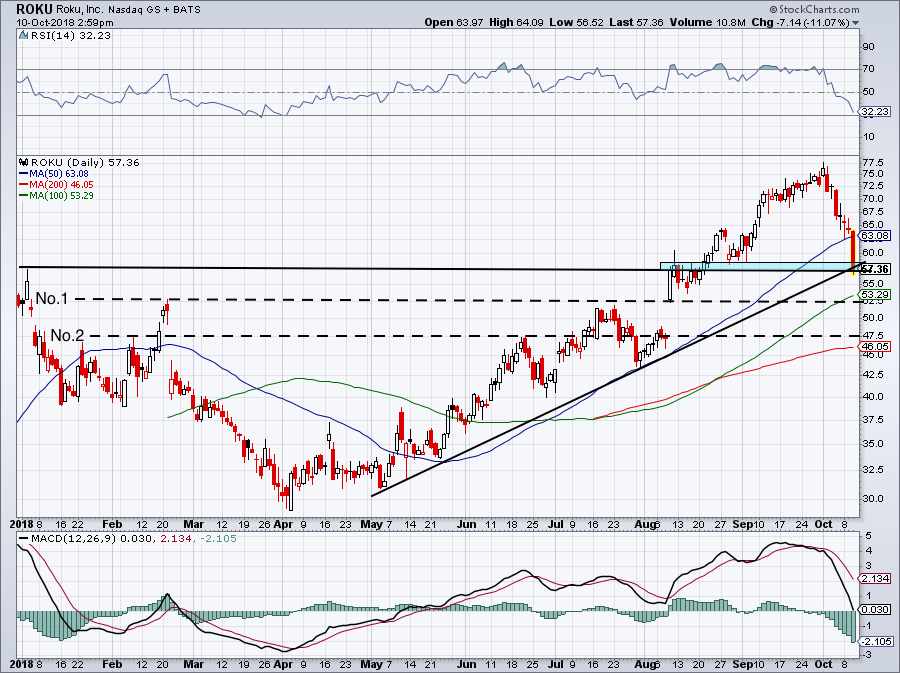
Must-See Stock Charts #5: Roku
Click to Enlarge
This growth monster took a whacking on Wednesday, falling more than 11%. But that doesn’t mean it’s all over for Roku (NASDAQ:ROKU).
I’m of the belief that eventually this wave of selling will end and companies like Roku will go back to flourishing. Still, shares are quickly down about $20 per share or 25% in just a few trading sessions.
Aggressive bulls with a long-term time horizon can nibble near current levels — gulp! — while more conservative bulls can dip their toe into the water near $52 to $53. That would put Roku near the earnings-fueled gap from August and the 100-day moving average.
Beyond that, the $47 to $48 area would be considered a must-buy for me, down near prior resistance and the 200-day moving average.
Bret Kenwell is the manager and author of Future Blue Chips and is on Twitter @BretKenwell. As of this writing, Bret Kenwell is long AAPL and CRM.