
U.S. stocks gapped significantly higher on Monday morning, only to watch most of all those gains and more fizzle away over the next few hours. It’s leaving many investors frustrated, tired and above all, annoyed with the current volatility. Some traders are loving it though. With that in mind, here’s a look at our top stock charts for Tuesday.
Top Stock Charts for Tomorrow #1: IBM

Click to Enlarge
IBM (NYSE:IBM) shares tanked on Monday morning, but recovered a bulk of its losses in the afternoon after investors digested its $34 billion acquisition of Red Hat (NYSE:RHT). We were just talking about IBM needing an acquisition if it wanted to turn its business woes around.
I don’t think many investors have a problem with the company buying Red Hat per se, I think it’s the 63% premium management gave RHT when buying it for $190 a share. That said, IBM needed to do something and this is something. So what do the charts say?
They don’t look pretty. There’s a reason we only wanted to own IBM post-earnings if $135 held as support. It didn’t and here we are around $120. If the markets can bottom (at least temporarily) this week, aggressive IBM bulls can trade against Monday’s low on the long side.
Below that and the $107 to $110 range is on the table. If IBM can get back above its downtrend line, a run into the $130 to $135 range is possible.
Top Stock Charts for Tomorrow #2: General Electric
Click to Enlarge
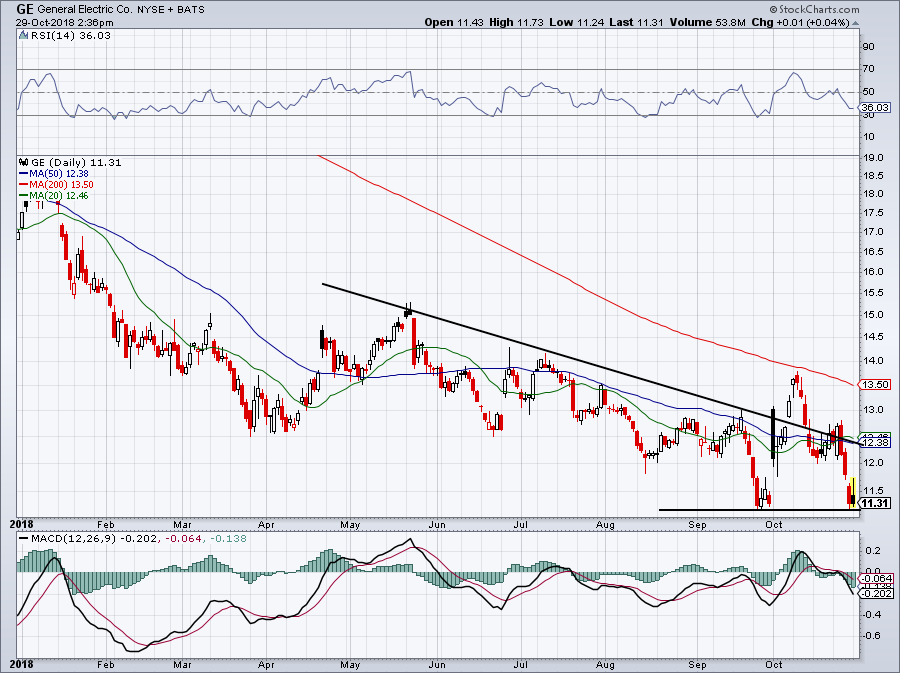
After a hot start to October, General Electric (NYSE:GE) has been nothing but a dud. GE stock also pushed back its earnings date and will now report on Tuesday before the open. What are the levels to watch?
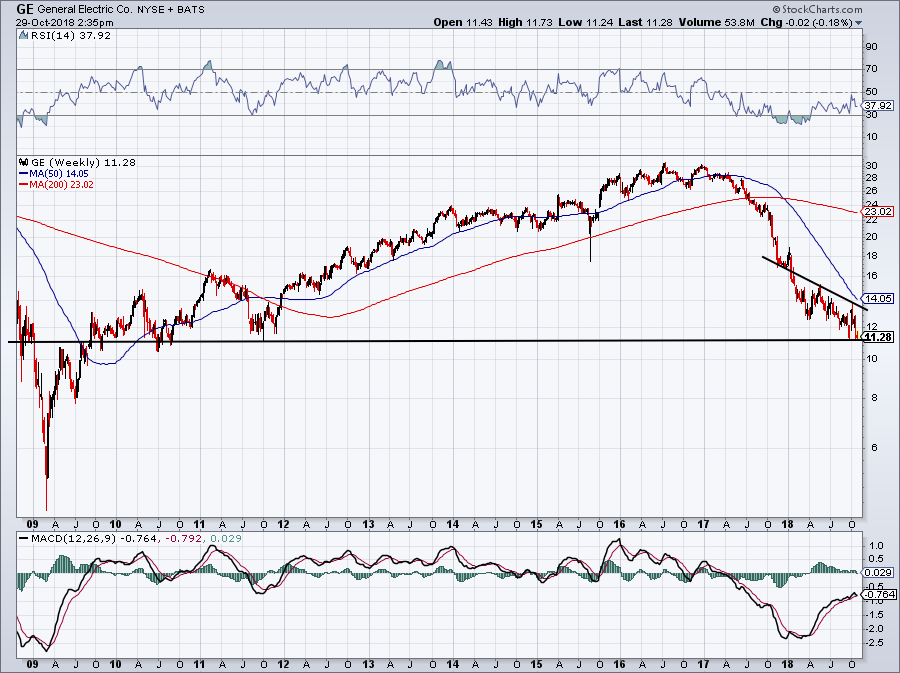
More than the open, I want to see how GE stock closes tomorrow. Above is a short-term chart and below is a 10-year weekly chart.
On a rally, I need to see a close above $12.50. On the short-term chart, we can see that would put GE above the 20-day and 50-day moving averages, along with a roughly-drawn downtrend line. Below this $11.25 area and trouble accelerates. That can be seen in the long-term chart below. A drop below current support would likely send GE to $10.
I would be more interested with the stock above $14 or so. That would put GE above the 200-day moving average, as well as the 50-week moving average and weekly downtrend resistance.
Click to Enlarge
Top Stock Charts for Tomorrow #3: Under Armour

Like GE, Under Armour (NYSE:UA, NYSE:UAA) will report earnings on Tuesday before the open.
A fall could be big trouble for UAA, as it will put the stock below a notable support level near $18. Although not ideal, so long as channel support holds, UAA is still technically okay.
I would rather see a close over $19. That would propel UAA over the 200-day moving average and channel resistance. Ideally, UAA would close over all three major moving averages too, but that seems like a tough ask in this market.
It’s worth stressing that investors shouldn’t take coin-toss trades. Be patient, wait for your setups and only take high-quality looks. If it doesn’t fit, take a pass. There’s nothing wrong with sitting on your hands and in fact, it’s encouraged that you do.
Top Stock Charts for Tomorrow #4: Canopy Growth
Click to Enlarge
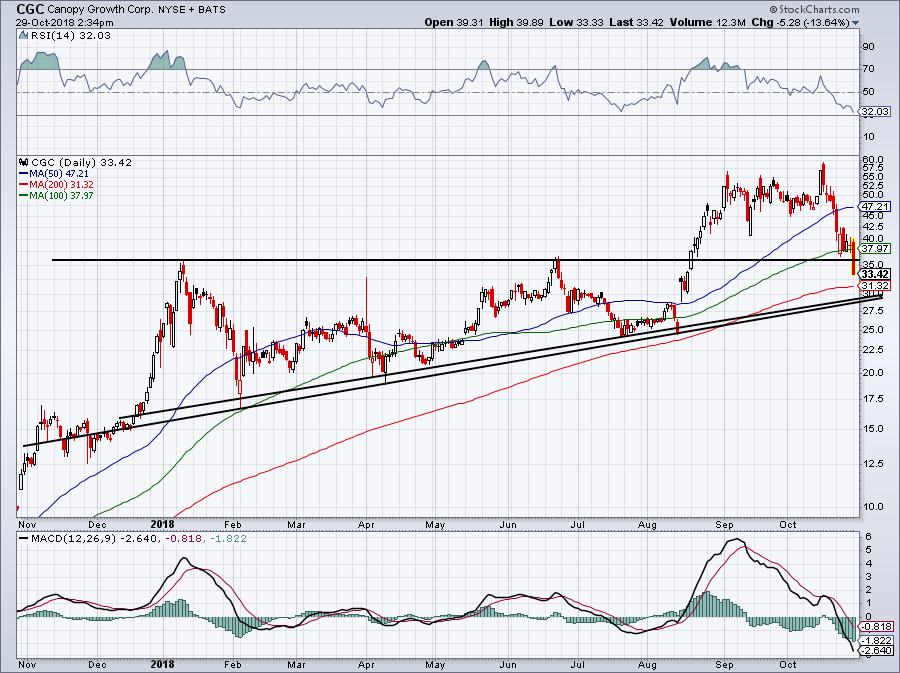
Pot stocks struggled on Monday, with Canopy Growth (NYSE:CGC) really tanking. Unfortunately, shares fell about 15% and went right through my ideal buy zone near $36. On the plus side, since it flushed right through it, we didn’t get sucked in and chopped up.
So now what?
Aggressive buyers will likely step in near the 200-day, while an overshoot to the $28 to $30 is likely good for a bounce.
Should both levels fail, a drop to $20 is technically in the cards. But let’s see how the 200-day and uptrend support holds up first.
Top Stock Charts for Tomorrow #5: Boeing

Click to Enlarge
Wow, what happened to Boeing (NYSE:BA) stock? The news about the Lion Air crash isn’t helping, even though the selloff didn’t really get underway until later in the afternoon.
Shares are tumbling lower, knifing right through the 100-day and 200-day moving averages, as well as uptrend support. Maybe BA catches a bid between $315 and $320 if the market can find some support. If not though, a drop down to the $290s is possible.
Let BA settle down for the next few days. This is a big decline for what was one of the market leaders.
Bret Kenwell is the manager and author of Future Blue Chips and is on Twitter @BretKenwell. As of this writing, Bret Kenwell did not hold a position in any of the aforementioned securities.