The bulls got Tuesday’s trading started on the right foot, following through on Monday’s intraday reversal effort. But, as the day wore on, doubts set in again. The S&P 500 ended the day down 0.04%, leaving trading still unsure about the true undertow.
Not every name was swept up in the bearish tide. New Age Beverages (NASDAQ:NBEV) gained nearly 8% during Tuesday’s action and added more than 3% more in after-hours trading after catching a cannabis tailwind. No specific news was revealed for or about the company.
There just weren’t enough stocks like New Age Beverages yesterday to keep the market in the black though. With high-profile names like General Electric (NYSE:GE) and Nvidia (NASDAQ:NVDA) both losing more than 2% yesterday, the market’s tone was decidedly bearish on Tuesday.
Still, there are trading opportunities for investors willing to pick and choose their battles and play on both sides of the fence. Stock charts of Wells Fargo (NYSE:WFC), NRG Energy (NYSE:NRG) and Zoetis (NYSE:ZTS
) are among the best of those possibilities heading into hump-day.
Zoetis (ZTS)

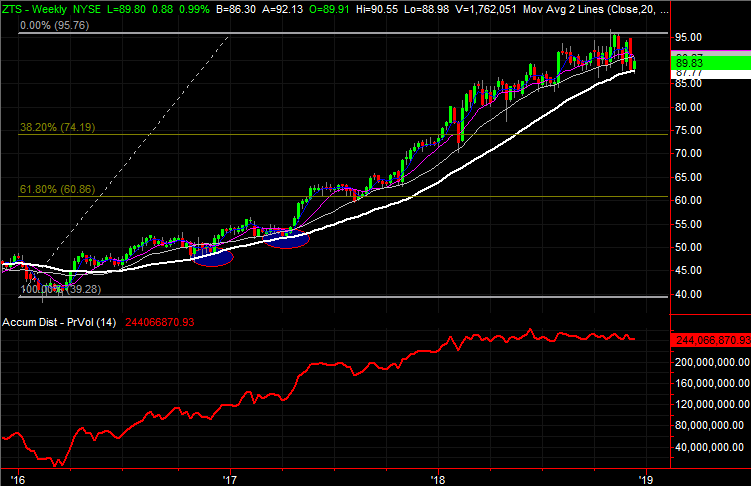
The past two years have been good ones for pharmaceutical company Zoetis, and by extension, for owners of ZTS stock. Shares are up more than 100% since their early 2016 low, in step with earnings and sales growth.
That advance is slowing down, however. In fact, it may be on the verge of an outright reversal. One more bad day could snap a key support line, and there’s nothing below it to stop that bleeding if and when it starts.
Click to Enlarge
• That test, however, is being administered against a backdrop of already-slowing momentum. That headwind began to blow in early 2018, when investors began to wonder if the stock’s price was out in front of earnings.
• If the 200-day moving average line fails to hold up as a support level, the next most likely landing point is the 38.2% Fibonacci retracement line around $74.20.
Wells Fargo (WFC)
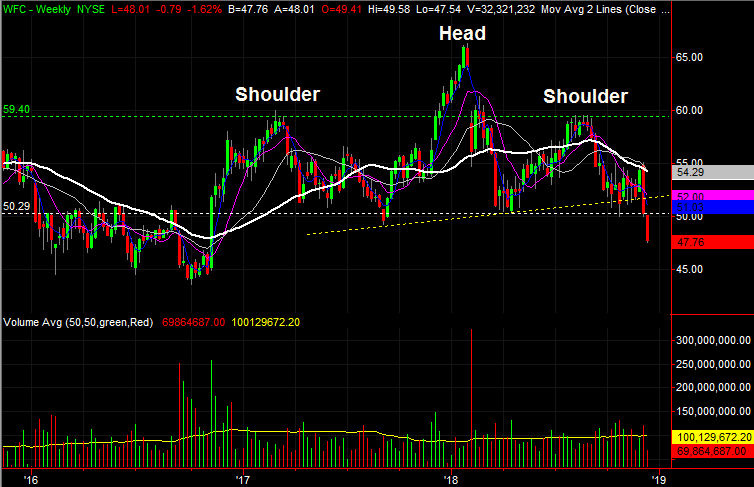
It’s got more to do with the broad attack on banks than it specifically has to do with Wells Fargo. But, WFC shares have made the most telling chart pattern as a result of the bashing of bank stocks within the past few days.
The pattern is a head-and-shoulders setup, which is essentially what it sounds like… a “head” with a “shoulder” in each side of it. The neckline has been broken as technical support, and now that it has, the three-hump pattern should drive Wells Fargo shares even lower than it’s already slumped.
Click to Enlarge
• Head-and-shoulder setup tend to drive a stock, once the neckline breaks, about the same distance between the peak of the ‘head’ and the neckline. In this case, that span is from $50.30 to $66.00. That $15.70 differential would theoretically mean a move all the way to $34.60, which is $15.70 below that neckline.
• While the head-and-shoulders setup is usually a good one with a high success rate, in this case, this budding breakdown is inextricably linked to the broad weakness in banks. If that changes, this downtrend could as well.
NRG Energy (NRG)
Finally, utility name NRG Energy has been on fire of late, largely in step with other utility stocks as investors seek out safety and shelter for the coming storm. NRG is up more than 30% just since July, even against a backdrop of rising interest rates.
But we’ve seen this kind of momentum before, and it’s petered out when it looked like it wouldn’t. This week’s bump into an established resistance line could be the catalyst that starts a wave of profit-taking.

Click to Enlarge
• In the weekly timeframe, NRG is stochastically overbought. It’s been so before, but it’s not stayed in that condition indefinitely.
• If the plausible pullback does take shape, notice the 200-day moving average line — give or take — tends to act as a floor.
As of this writing, James Brumley did not hold a position in any of the aforementioned securities. You can follow him on Twitter, at @jbrumley.