We saw more stagnation for stocks yesterday, with traders waiting for this week’s hard-hitting earnings reports.
Apple (NASDAQ:AAPL) was the biggie, of course, and it was mostly good news. The consumer-tech giant saw its stock lose ground headed into the close, but was up in after-hours action after topping last quarter’s sales and earnings expectations. The biggest movers on Tuesday, however, weren’t the market’s most-watched names. PG&E (NYSE:PCG) jumped 16.5% after officially filing for bankruptcy protection. The terms of the petition suggest the company will survive. Meanwhile, GameStop (NYSE:GME) shares plunged to the tune of 27.2% after the struggling company announced it wasn’t putting itself up for sale after all.
Between the extreme volatility at both ends of the spectrum and the hesitation to do much of anything until Microsoft (NASDAQ:MSFT) posts its numbers (and the FOMC makes its interest rate decision — both slated for today), stocks weren’t prepared to go much of anywhere on Tuesday. And, they didn’t. The S&P 500 fell, but only by 0.15%.
As Wednesday’s action kicks off what’s hopefully a more fruitful trading session, the stock charts of Molson Coors Brewing (NYSE:TAP), Home Depot (NYSE:
HD) and A.O. Smith (NYSE:AOS) are in focus. All three have sidestepped the recent extreme volatility, and are setting up what could be some great moves.
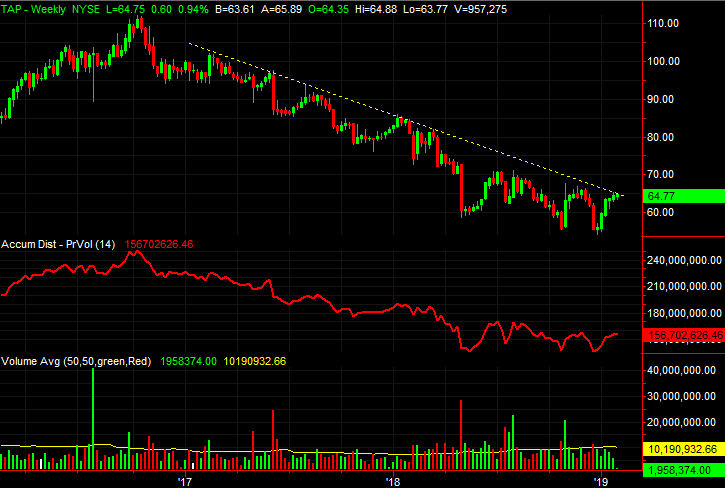
Molson Coors Brewing Co (TAP)
Molson Coors Brewing shares have been sliding lower since the middle of 2016. Just when it looks like they may finally turn the ship around, the stock finds a way of moving to lower lows. The company’s modest earnings growth hasn’t been able to overcome investor pessimism.
That may be on the verge of changing though. Thanks to yesterday’s gain, TAP has cleared a major hurdle and is knocking on the door of another huge resistance line. There’s still a little work that needs to be done, but there’s a potential, major recovery effort brewing that few people even think might be coming.
Click to Enlarge
• Simultaneously, Molson Coors shares are now testing straight-line resistance, plotted with a yellow dashed line on the weekly chart, that has capped the stock since early 2017.
• A move above these two technical ceilings will be more of a process than an event. So, even if TAP breaks out and then falls back below those lines, don’t count it out. Watch how it reacts when firmly tested.
A.O. Smith (AOS)
Like most other stocks, A.O. Smith lost ground yesterday. Unlike most other stocks, however, the stall here is actually unsurprising, and even a little constructive. The pause better defined where a big line in the sand is, and more than that, it confirmed the bulls aren’t going to be intimidated. They’re trying to stage a breakout move.

Click to Enlarge
• Though it closed at a loss, yesterday’s close was still well above the open and well above the blue 200-day moving average line, which rekindled the rally effort when tested. The fact that the buyers continue to swing suggests the wall the bears have built may not hold much longer.
• Given how well defined the ceiling at $48.70 is, don’t dismiss the possibility that even a modest move above it could incite a major thrust that blasts right past the white 200-day average line around $54.70. There’s a lot of pent-up bullishness that can be unleashed here.
Home Depot (HD)
Finally, Home Depot has been anything but immune to recent trouble for the broad market. Not only is it vulnerable to economic stagnation stemming from a tariff war with China, it’s even more vulnerable to the slowdown that some say is already impacting the housing construction market.
Slowly but surely, though, clues are piling up that say HD is ready and able to unwind the rout it suffered during the fourth quarter of last year. One more good day could do the trick, though it would take a few great days in a row to seal the deal.
• More than that, however, the recent push up and off of support provided by the blue 20-day moving average line has completed a decent (albeit not perfect) upside-down head-and-shoulders pattern. Once the neckline around $181 is broken, would-be buyers could start to flood in.
• Beyond that, the 100-day and 200-day moving average lines at $188.66 and $184.26, respectively, stand as potential roadblocks. There’s more underlying bullish momentum brewing up than it currently seems though.
As of this writing, James Brumley did not hold a position in any of the aforementioned securities. You can follow him on Twitter, at @jbrumley.