
With Advanced Micro Devices (NASDAQ:AMD) and Apple (NASDAQ:AAPL) reporting earnings after the close and Fed Chair Jerome Powell making an FOMC statement on Wednesday afternoon, investors are in no mood to make any drastic moves on Tuesday. Let’s look at a handful of must-see stock charts for Wednesday.
Must-See Stock Charts #1: Square
Click to Enlarge
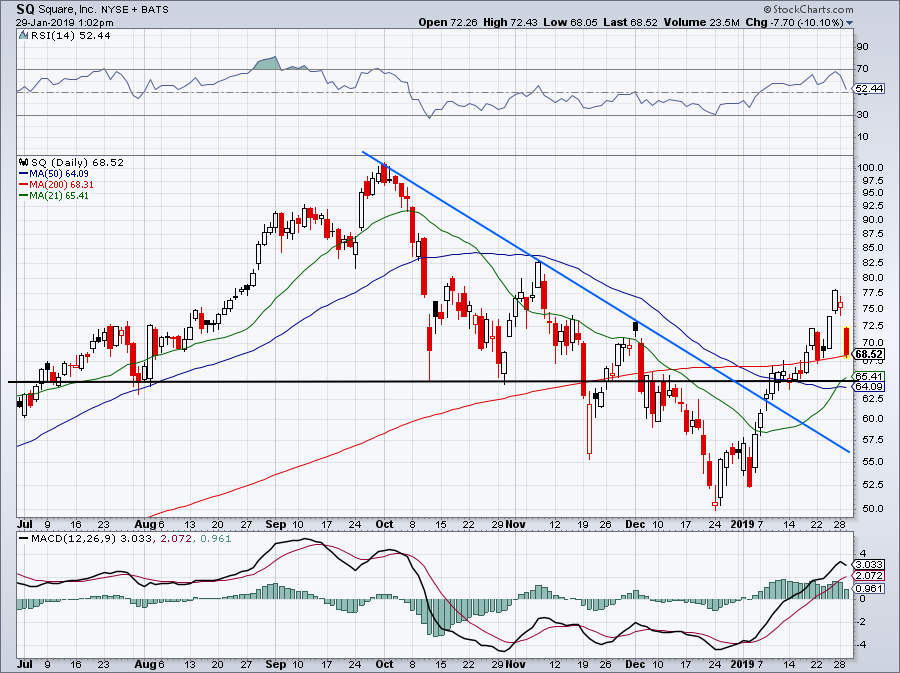
Shares of Square (NYSE:SQ) are getting hammered after the company received a negative take from the analyst community. The stock is tumbling hard on Tuesday, down more than 10%.
The silver lining? That shares are — so far — holding up over the 200-day moving average. We got the breakout we were looking for, but Tuesday’s price action was a rude awakening for investors looking for more upside.
This stock is a volatile one though and so moves like this can never be ruled out. I’d like to see SQ stay above its 200-day and preferably its 50-day. Over $65 and bulls should still be okay. Below that and the 50-day, and bulls will have some problems.
Must-See Stock Charts #2: Lockheed Martin
Click to Enlarge
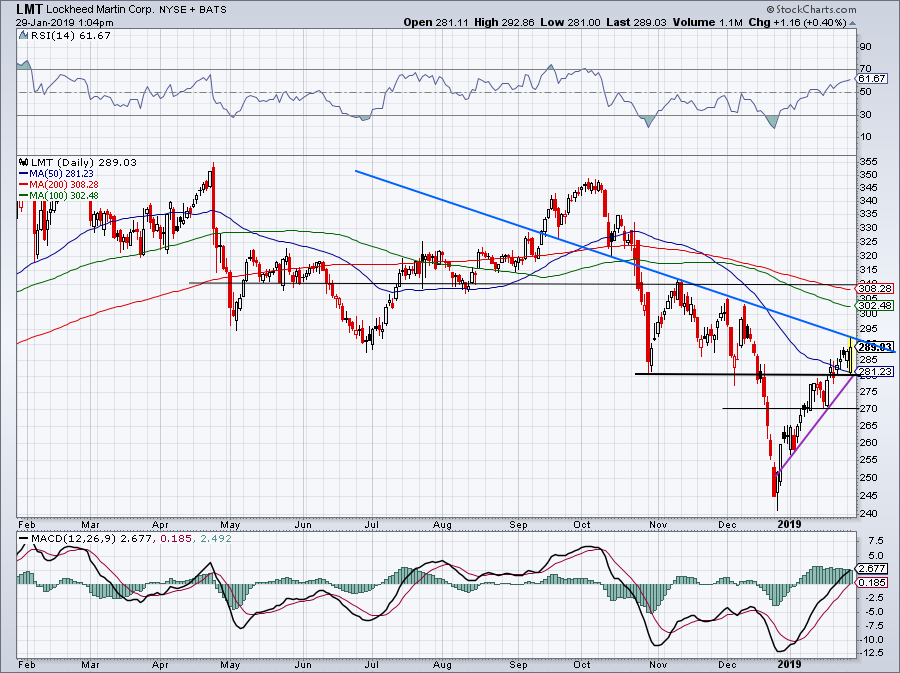
Shares of Lockheed Martin (NYSE:LMT) are close to flat on the session despite a top- and bottom-line earnings beat.
We’re now caught in a precarious place with LMT stock. Shares are holding up over uptrend support and the 50-day moving average, but are being held in check by downtrend resistance. That sets it up for a binary event: either support gives way or resistance gives way.
If it’s the former, we have to see if $270 acts as support or what level comes into play while LMT is in no man’s land. If it’s the latter and resistance gives way, a run up to the 100-day and 200-day moving averages are in the cards and $310 becomes possible.
Must-See Stock Charts #3: Harley-Davidson
Click to Enlarge
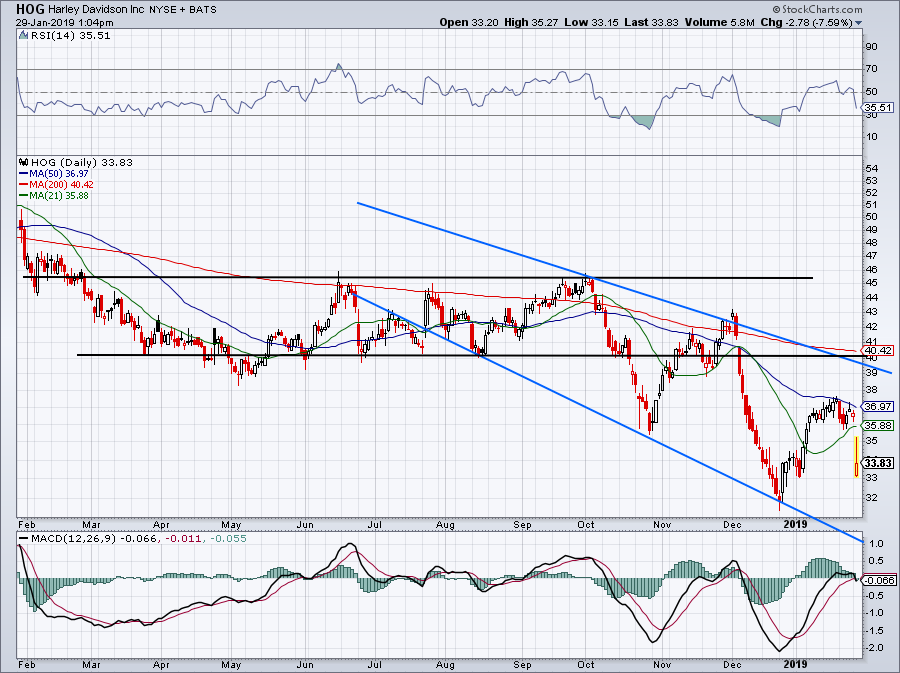
Harley-Davidson (NYSE:HOG) is tumbling after a disappointing earnings result, falling 7.5% on the day. Shares are well off session highs and a retest of the December lows looks imminent.
Should we get a rally in HOG, the 50-day moving average is clear resistance. Look to see if $32 acts as support on the downside. This pig is not attractive at current levels.
Must-See Stock Charts #4: 3M Co
Click to Enlarge
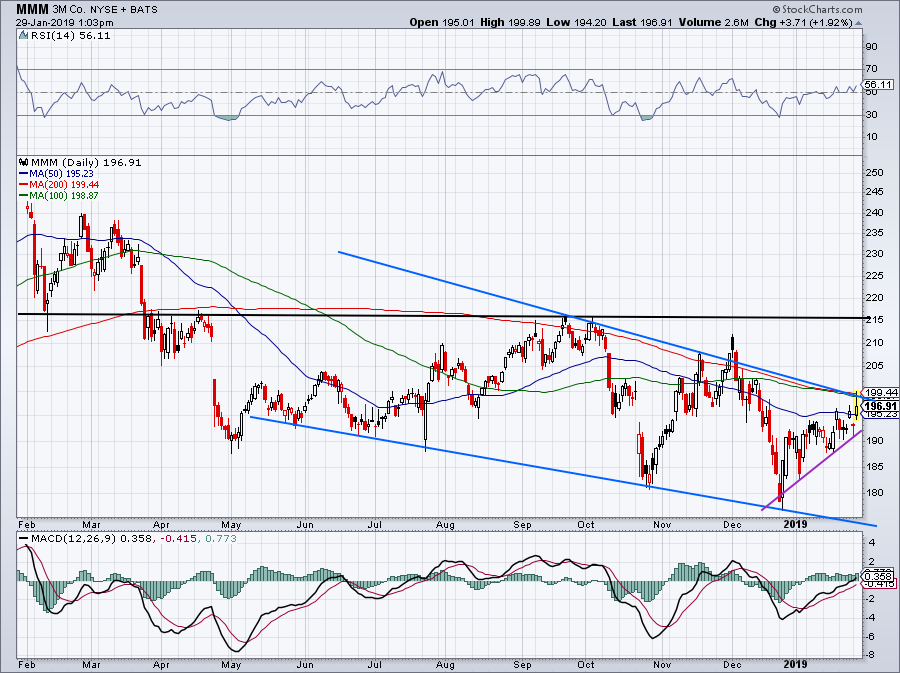
3M Co (NYSE:MMM) is up about 2% after the company beat on earnings and revenue expectations. The stock is similar to LMT in that it’s sandwiched between rising support and falling resistance. At some point, something’s got to give, it’s just a matter of which one it will be.
Over $200 could ignite a move up to $210 to $215. That would clear MMM of its 100-day and 200-day moving averages, as well as downtrend resistance. Below $190 and it would be below those moving averages, as well as its 50-day moving average and uptrend support. If that happens, a decline to ~$182 is possible.
Must-See Stock Charts #5: GameStop

Ugly, ugly action in GameStop (NYSE:GME). Shares are down more than 25% after the company said it is no longer exploring a sale. That’s got GME probing new 52-week lows and breaking below key support at $11.50.
GameStop is not an attractive name to me and this plunge is no surprise at all. For bulls who want to dip their toes in the water, wait for a close over $11.50. Until then, GME could keep on sinking.
Bret Kenwell is the manager and author of Future Blue Chips and is on Twitter @BretKenwell. As of this writing, Bret Kenwell is long AAPL.