Thursday’s 0.39% setback for the S&P 500 shouldn’t come as a complete surprise. The rally from its late-December low is more than overextended, and even prior to Thursday we’ve seen the advance slow down.
 Only time will tell if this is an omen of what’s to come or just a well-deserved breather for the bulls.
Roku (NASDAQ:ROKU) did much of the damage, falling more than 4% during regular market hours, in front of its post-close earnings report. While a solid fourth-quarter beat undid all that damage in the after-hours session, that won’t help the broad market’s indices until today. Tesla (NASDAQ:TSLA), meanwhile, fell 3.7% on reports that Consumer Reports would no longer be recommending its Model 3 electric vehicle due to reliability issues.
Boston Beer Company (NYSE:SAM) soared more than 14% after posting impressive fourth-quarter results. But, with more bearish volume than bullish volume yesterday, and more decliners than advancers the overall market didn’t stand a chance.
Headed into the final trading day of the week, it’s the stock charts of Mattel (NASDAQ:MAT), Equifax (NYSE:EFX) and Kimberly Clark (NYSE:KMB
) that are of the most interest. They’re each acting as if they’re going to make moves independent of the market tide.
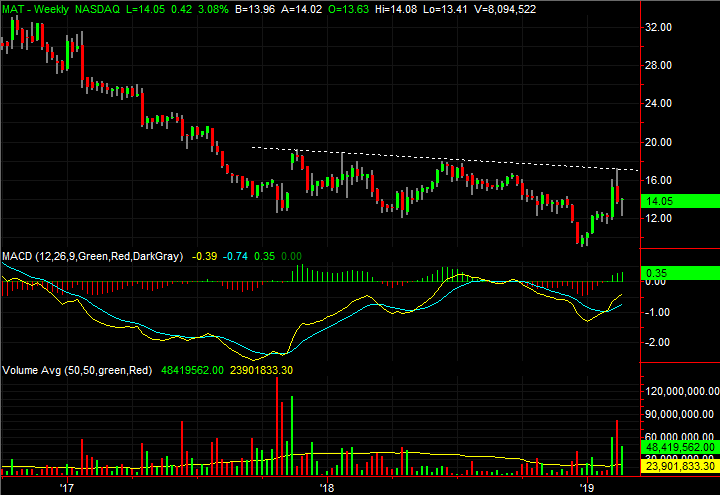
Mattel (MAT)
Earlier this month, the market was cheering Mattel’s apparent turnaround. Shares surged — gapped — 15% on Feb. 8 following a key fourth-quarter earnings and revenue beat, and continued to edge higher for the next several days. That bullish move was completely wiped away late last week and early this week following the release of a 2019 outlook that called into question the suggestion made by the toymaker’s fourth-quarter numbers. Many investors assumed it just wasn’t meant for Mattel to ever thrive again.
The steep setback MAT stock has dished out following the post-earnings runup, however, may have been far more innocent and far more constructive than anyone might suspect.
Click to Enlarge
• There’s still one last hurdle to clear, however, before MAT shares can get back into a fully bullish groove. The rally may have been quelled by the revisits of a technical ceiling that’s tagged all the major highs going back to late 2017. That ceiling is plotted with a white dashed line on the weekly chart.
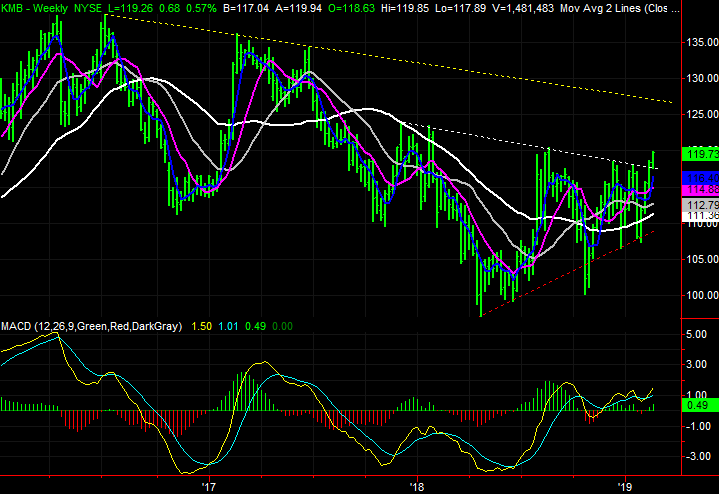
Kimberly Clark (KMB)
With just a quick glance, shares of Kimberly Clark look like nothing more than an indecisive, volatile mess. Take a step back and look at the bigger picture, though, and there’s a method to the madness. KMB has been working on a breakout thrust for a while, and it became a reality this week.
Click to Enlarge
• There’s more to the move than just a higher high though. It took shape in the shadow of a string of higher lows made since the middle of last year. The new floor is marked with a red dashed line on both stock charts.
• If this move gets traction, the next most plausible ceiling is around $126. That line tags all the major peaks from 2016 and early 2017, and is marked with a yellow dashed line.
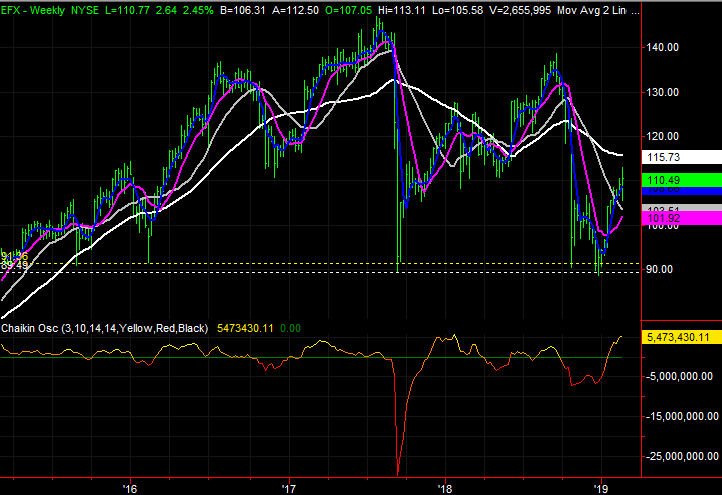
Equifax (EFX)
Finally, there was a point not too long ago when investors were wondering if Equifax would ever truly recover from its embarrassing 2017 data breach. Not only did that up-end the stock, just when EFX had clawed its way back in 2018, the rug got pulled out from underneath it again in October. By December of last year, it was back to its 2017 lows.
There was more going on the whole time than it may have seemed, however. And, thanks to yesterday’s subtle (and far from infallible) clue, Equifax may have become an interesting even if not ironclad bet.
Click to Enlarge
• In retrospect, one can’t help but wonder if a rebound was in the cards no matter what. Last year’s lows essentially align with all the major lows going back to 2015.
• The clincher for bullishness would be a move back above the white 200-day moving average line, currently around $115.93. But, it’s already encouraging to see a couple of high-volume advances and support at the gray 100-day moving average line.
As of this writing, James Brumley did not hold a position in any of the aforementioned securities. You can learn more about James at his site, jamesbrumley.com, or follow him on Twitter, at @jbrumley.