Stocks mustered their second day of consecutive gains on Thursday, although not without a couple of hiccups. Still riding the euphoria wave put in motion by Wednesday’s dovishness from the Federal Reserve, the S&P 500 advanced 0.86% to move within striking distance of some key resistance levels.
General Electric (NYSE:GE) and Facebook (NASDAQ:FB) did most of the heavy lifting. The beleaguered industrial giant saw its share soar more than 11% after posting fourth-quarter numbers suggesting the company isn’t beyond salvaging just yet. Meanwhile, the king of social networking’s stock jumped almost the same amount after reporting Q4 earnings and revenue that topped expectations.
Some of the losers, however, were big losers. DowDuPont (NYSE:DWDP) dragged the Dow Jones Industrial Average to a small loss on Thursday when the stock tanked to the tune of 9.2% following a lackluster fourth-quarter print and a similarly lackluster outlook.
The wild swings continue to make most names too tough to trade, though the stock charts of Hologic (NASDAQ:HOLX), Microsoft (NASDAQ:MSFT) and
PulteGroup (NYSE:PHM) have mostly sidestepped that volatility to work on the development of their own trends.
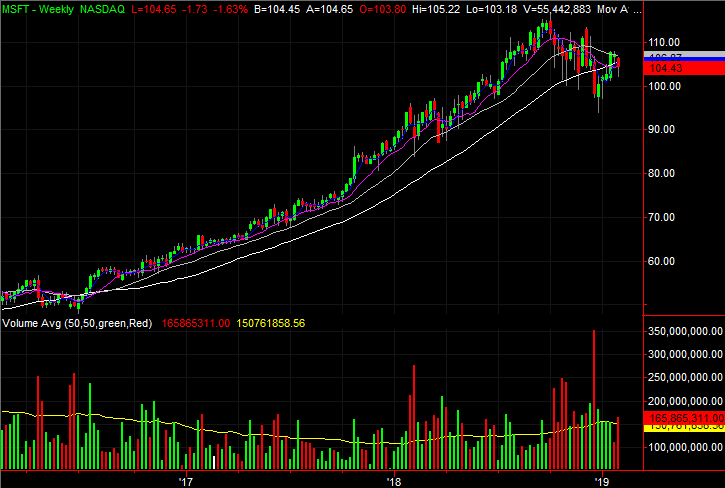
Microsoft (MSFT)
With just a quick glance, it would be easy to chalk up yesterday’s pullback from Microsoft as a typical reaction to a so-so earnings report. Indeed, the 1.8% stumble isn’t even all that remarkable.
There may be more at work here than just the reaction to the company’s fiscal Q2 numbers, though. In taking a step back and looking at the bigger picture, it’s possible a setback was inevitable yesterday. In fact, it’s possible a little more downside from here is already a foregone conclusion.
Click to Enlarge
• Arguably worse, as of yesterday, the purple 50-day moving average line has crossed below the white 200-day average. This so-called “death cross” will likely be viewed by some traders as a clear sell signal starting today.
• One has to zoom out to the weekly chart to see it, but Microsoft shares moved into an overbought condition over the course of 2017 and 2018. That has left it vulnerable to profit-taking here and now. A lower low today could trigger the next bearish leg.
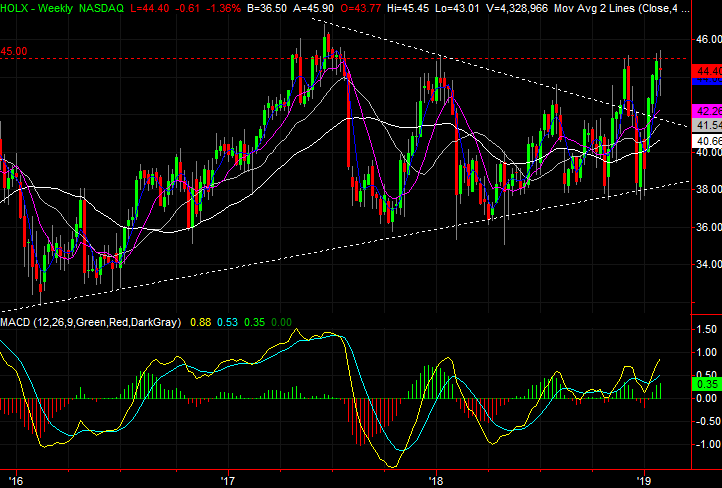
Hologic (HOLX)
If Hologic rings a bell, there’s a good reasons. It’s one of the stock charts we’ve dissected multiple times in recent weeks as it navigates its way through a couple of different trading ranges.
It’s now above one, but still stuck inside the other. But, with this week’s volatility thus far on the books, it’s worth another look just because it’s so close to completing the breakout effort that’s been in the works for months.
Click to Enlarge
• Also in play is the converging wedge shape that was cleared in November. It’s plotted with white dashed lines on both stock charts, and though Hologic fell back inside that range in December, crawling back out of it in January wasn’t a problem.
• Although shares tried to break above $45.20 yesterday and ultimately failed, the bulls held their ground reasonably well. More specifically, it’s encouraging that traders kept Hologic in position to make another try today.
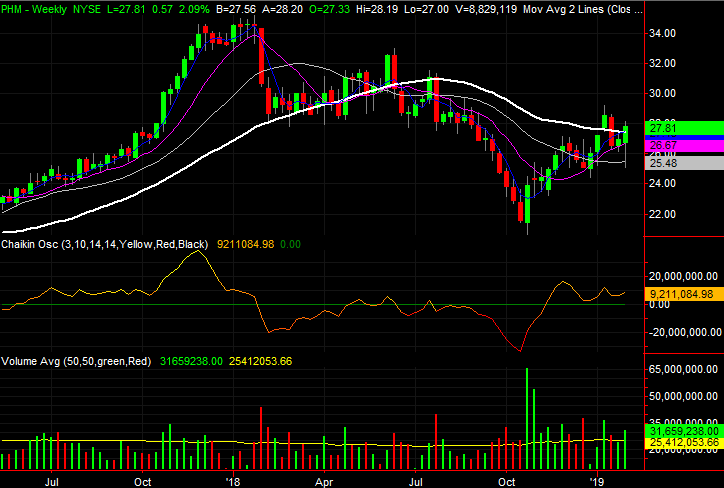
PulteGroup (PHM)
Finally, though we’ve seen PulteGroup start a breakout thrust in early January that ultimately failed, this second effort is noteworthy. Often times it’s the second effort that sticks in place and actually gets the job done.
Besides, the pullback from the previous bullish thrust actually cleaned up a key liability and cleared the deck for a more sustainable rally now.
Click to Enlarge
• That short dip in mid-January, in fact, went back to fill in the big gap left behind at the beginning of the month. Generally speaking, the market doesn’t like to leave such gaps behind.
• Nevertheless, though there’s clearly more bullish volume than bearish volume in play, one more higher close above the 200-day moving average would firm up this incomplete bullish clue.
As of this writing, James Brumley did not hold a position in any of the aforementioned securities. You can follow him on Twitter, at @jbrumley.