Investors came back in a much better mood to start the new week than they ended the previous week in. The S&P 500 ended yesterday up 1.47%, carrying the index back above its pivotal 200-day moving average line.
 General Electric (NYSE:GE) did a great deal of the heavy-lifting, gaining 3.3% after Citigroup suggested the worst of its pain was in the past. Advanced Micro Devices (NASDAQ:AMD) actually logged a bigger gain though, advancing 4.3% thanks to a convergence of bullish ideas that had been brewing up a buying spree for some time.
When all was said and done, however, Monday’s bullish volume was uncomfortably low, and there were more decliners than a marketwide 1.47% gain might normally leave behind.
Boeing (NYSE:BA) was one of those big losers, stumbling 5.3% after a 737 was involved in a crash — the second such multi-fatality crash involving the same, relatively new Boeing plane within just a few months. Investors are fearing a design flaw is the culprit, which could prove catastrophic.
Headed into Tuesday’s trading, stock charts of NiSource (NYSE:NI), Nielsen Holdings (NYSE:NLSN) and PulteGroup (NYSE:PHM) are of the most interest. Here’s why, and what to look for next.
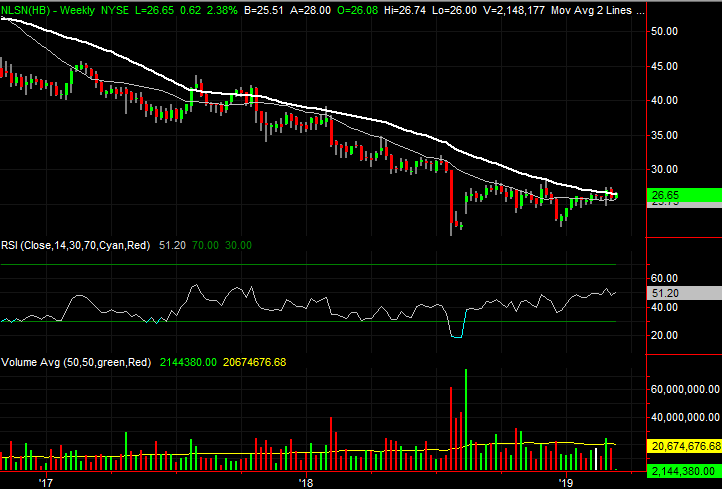
Nielsen Holdings (NLSN)
With nothing more than a quick glance, Nielsen Holdings looks like little more than a volatile mess. There’s been no net progress since September of last year, and no particular reason to expect that to change.
Slowly but surely over the course of the past several weeks though, the proverbial wheels have been turning. The bulls are inching closer to a breakout thrust, and one more good day could get NLSN over a key hump.
Click to Enlarge
• Nielsen is moving into the attempt in good condition. Since the beginning of February we’ve seen multiple instances of support at the purple 50-day moving average line. It’s acting as a pushoff point.
• This effort to cleanly break above 200-day moving average line has the same key flaw the last few failed attempts had — a lack of volume. But if Nielsen can continue to work its way higher, it’s likely to gather more volume on the way up.
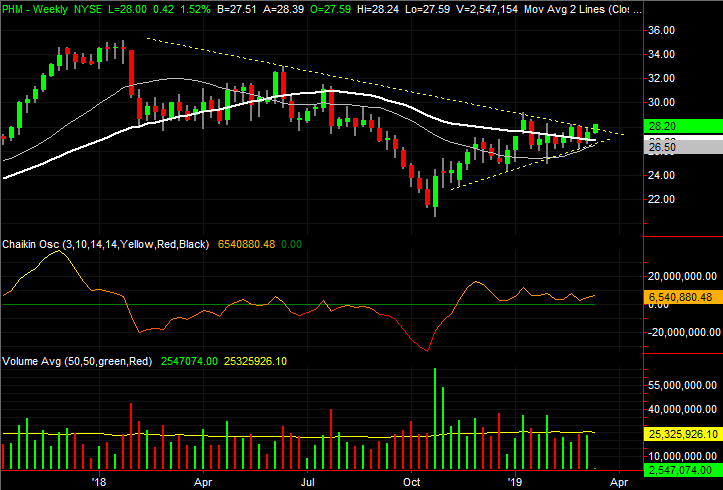
PulteGroup (PHM)
Roughly a week ago, PulteGroup was thrust into the trading spotlight as a potential break candidate. It was being squeezed into the tip of a converging wedge, but simultaneously was finding support more than it was finding resistance at its key moving average lines.
Yesterday it got over that hump. Though there’s one more hurdle to clear, the technical undertow has turned verifiably bullish.
Click to Enlarge
• Although it has been missing over the last few days, the volume trend has been leaning bullishly for the past several weeks.
• As of Monday, the purple 50-day moving average line has crossed back above the white 200-day moving average line … a so-called “golden cross” that’s supposed to indicate a confirmed bullish trend.
• The last line in the sand is $28.22, plotted with a red dashed line on the daily chart. PHM has peaked there three times since late January.
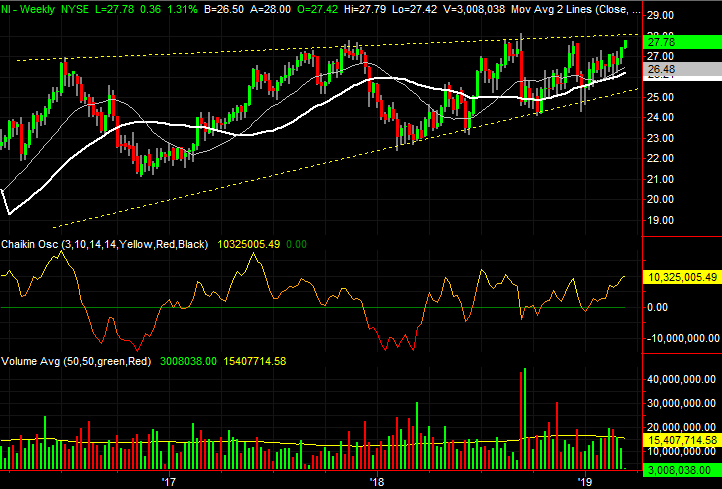
NiSource (NI)
Finally, a month ago NiSource was featured as — like Pulte — a breakout candidate close to be squeezed out of a pair of converging support and resistance lines. Unlike PHM, NiSource’s also had a horizontal ceiling it was contending with. Either way, the steam managed to build long enough to push NI above one resistance level, and put the stock within reach of the other. One or two more good days could do the trick, but they may not take shape straight away.
Click to Enlarge
• Zooming out to the weekly chart of NiSource we can see there’s also an ascending wedge pattern in place, framed by yellow dashed lines. The upper boundary here is not broken yet, but if it is, a couple years’ worth of pent-up trading action could be unleashed.
• Though a compelling setup, NI shares are technically overbought right now. A small pullback may be in the cards before the stock can blast past all of its technical resistance.
As of this writing, James Brumley did not hold a position in any of the aforementioned securities. You can learn more about James at his site, jamesbrumley.com, or follow him on Twitter, at @jbrumley.