
Major U.S. equities are well off the morning highs, but are still showing some respectable gains after the bond market has cooled off a bit. There is a deep concern that we’re flirting with a global recession, as yield curves threaten to invert and rates turn negative in some cases. In either case, we can trade around these obstacles. Let’s look at a few must-see stock charts going into Wednesday.
Must-See Stock Charts #1: Bed Bath & Beyond
Click to Enlarge
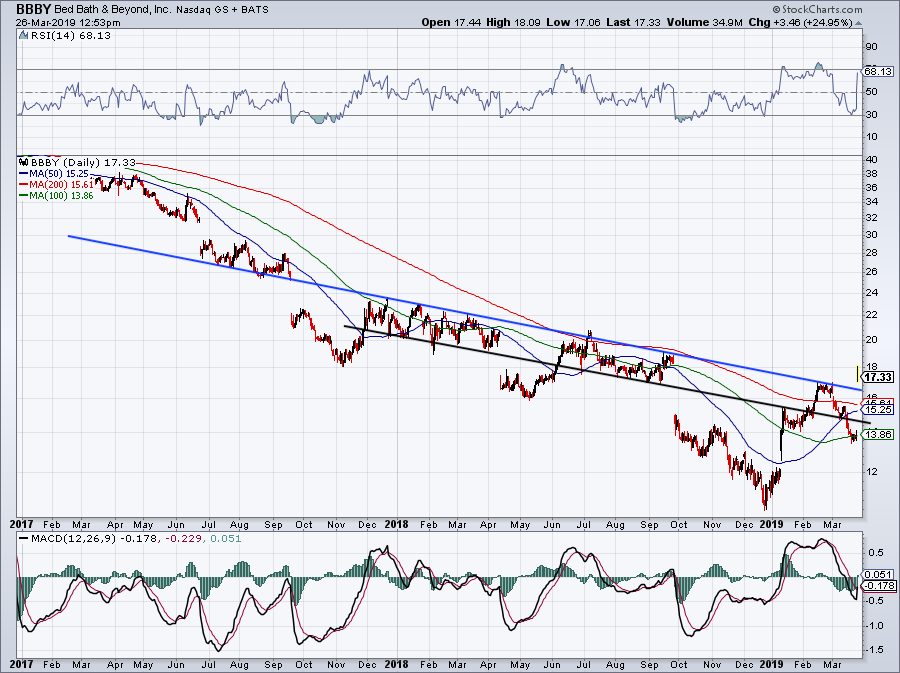
Shares of Bed Bath & Beyond (NASDAQ:BBBY) are surging on Tuesday, up 25% as activists get to work in the name.
After a rally like that, it’s hard to be a new buyer on Tuesday afternoon, but Wednesday morning could provide opportunity. With a move like this, bulls can hope for a slightly lower open that quickly goes green. That gives investors the green light for a potential swing trade, but at the very least, a bullish day trade. We can use the session’s low as the stop-loss, provided it’s a reasonable risk.
If BBBY can clear $17.70, it will be over the 61.8% Fibonacci retracement for the 52-week range. However, so long as the stock stays over prior downtrend resistance (blue line), investors can stay long. That said, if I came into Tuesday long BBBY as a trade, I would book profits.
Must-See Stock Charts #2: Nio
Click to Enlarge
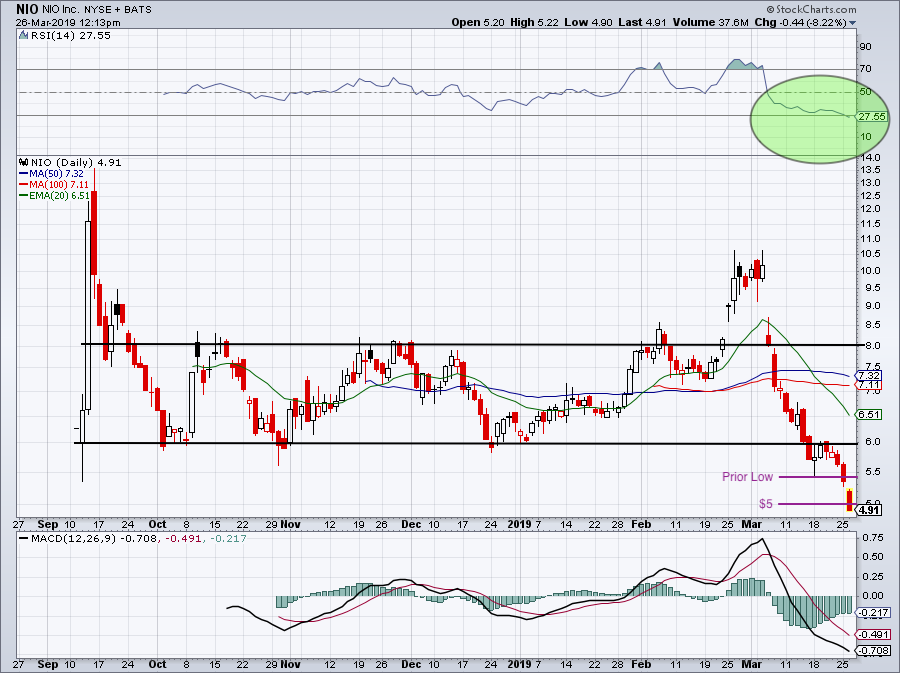
Earlier this month, we called out Nio’s (NASDAQ:NIO) retest of the $6 level. After failing as support, we said Nio stock needed to recapture this level for bulls to justify a long position.
This level promptly rejected Nio stock and after five straight sessions of declines, the stock is now breaking below $5. I wouldn’t be surprised to see bulls salvage this level, although $5 was probably a stop-loss level for many recent buyers in the name.
For now, Nio stock is a no-touch for me. I don’t like that, despite the giant decline, shares are barely in oversold territory according to the RSI (green circle). The action in Tesla (NASDAQ:TSLA) hasn’t been very encouraging either.
Must-See Stock Charts #3: Johnson & Johnson
Click to Enlarge
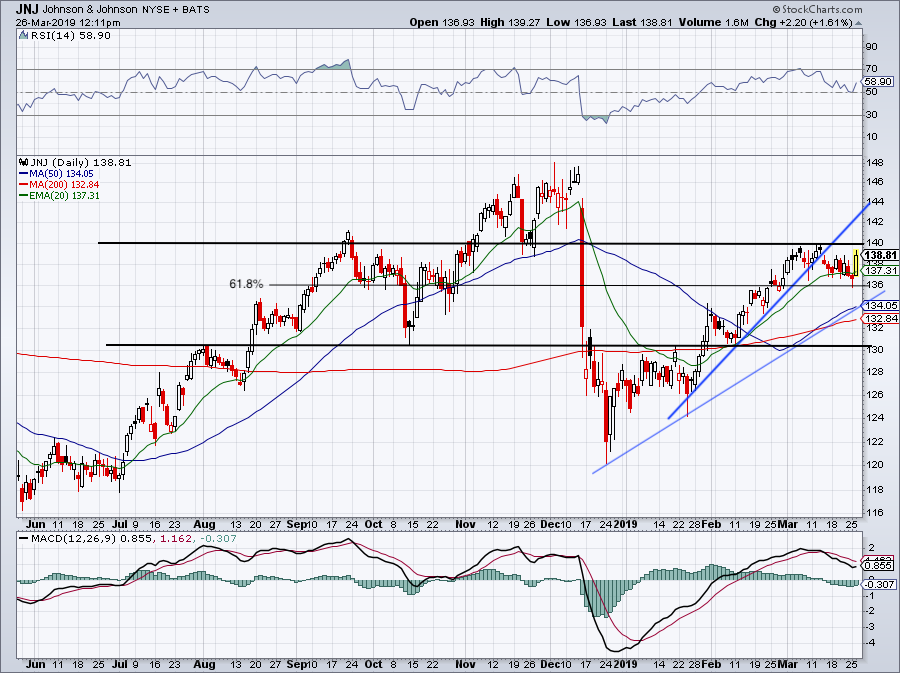
Shares of Johnson & Johnson (NYSE:JNJ) are moving nicely on Tuesday, up 1.5% on the day. It continues to hold the 20-day moving average and the $136 level, the latter of which serves as the 61.8% retracement for the 52-week range.
This one has been more volatile than long-term investors have been used to. However, it has consolidated nicely after a strong rally in February. That paints a good picture for bulls, barring any unforeseen circumstances.
On a move over $140, perhaps JNJ can garner some upside, possibly pushing as high as $145. If it does, it sets up a retest of the highs. Holding $136 and the 50-day would be bullish for JNJ, but really, as long as it’s over $130, bulls are likely okay — particularly given than many are long-term holders of the name.
Must-See Stock Charts #4: Crude Oil
Click to Enlarge
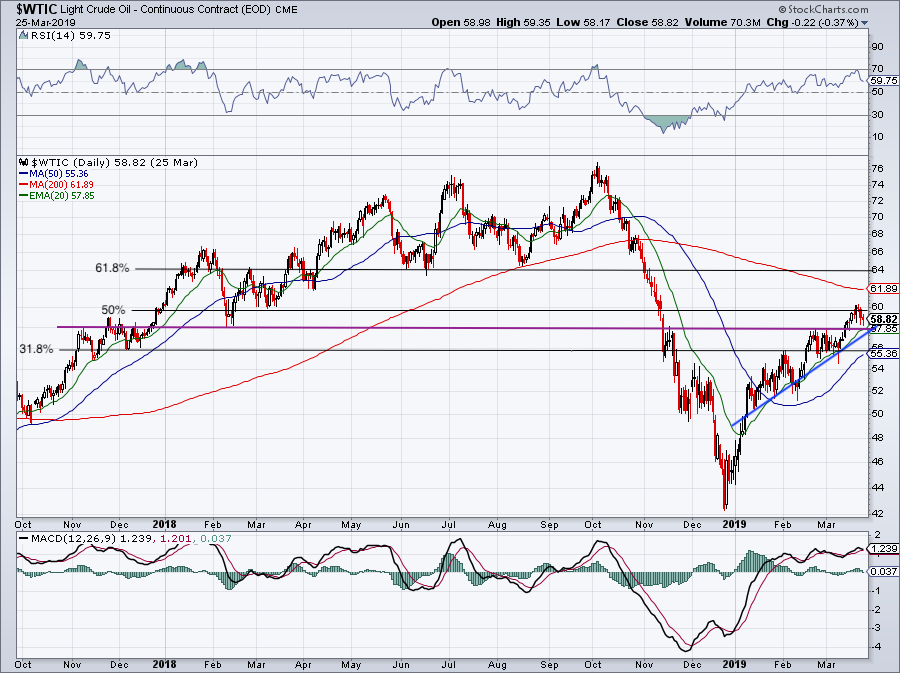
WTI crude continues its march higher. Some may play crude oil in the future market, others may prefer to use the United States Oil ETF (NYSEARCA:USO). Some may use oil as a stock-market barometer.
Look at how aggressively this commodity has come up off the lows, up almost 40% from its December lows. It’s holding uptrend support and the 20-day moving average. fSo even though it was rejected from $60 and the 50% retracement, we shouldn’t get too bearish on oil.
Below the 50-day would be a different story and oil would need to reset. If oil continues higher, look for a test of the 200-day moving average. Above that and the 61.8% is near $64. Know your levels and know your time frames.
Must-See Stock Charts #5: Carnival Cruise
Click to Enlarge
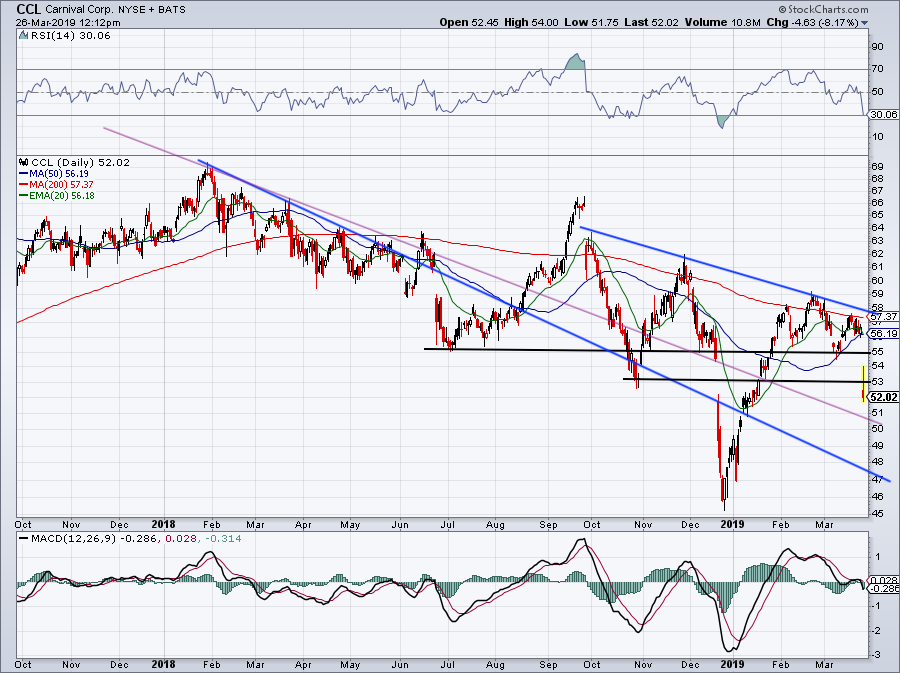
Rising oil prices isn’t good for everyone, as airlines and cruise ship operators suffer. Case in point, Carnival Cruise (NYSE:CCL) beat on earnings this morning, but guidance disappointed Wall Street as management says higher fuel costs are eating into the bottom line (see above).
As a result, shares of CCL are getting hammered, down over 9% on the day. The decline slammed Carnival below its 50-day moving average, as well as potential support at $53 and $55. Now what?
Shares are sort of in no man’s land here. Let’s see how CCL shakes out over the rest of this week. That will likely determine if it’ll keep its $50-handle or if it’s headed for the $40s.
Bret Kenwell is the manager and author of Future Blue Chips and is on Twitter @BretKenwell. As of this writing, Bret Kenwell did not hold a position in any of the aforementioned securities.