A strong end to a strong week left the S&P 500 at its best weekly close since September. Namely, the close at 2,892.74 was 0.46% better than Thursday’s last trade, capping off a 2.0% gain for the five-day span.
 Snap (NYSE:SNAP) set the pace, gaining nearly 5% during the session’s regular hours only to add another 5% in after-hours action as investors celebrated the company’s foray into social gaming. RBC upgraded SNAP stock, and raised its price target from $10 to $17. Chesapeake Energy (NYSE:CHK) fared well too, up a little more than 6% during the session, largely driven by ongoing gains in the price of gas and oil.
Not all stocks ended Friday in the black, however. Holding the marketwide bullish effort back was Boston Beer Company (NYSE:SAM). Shares of the brewer fell 5.5% in response to a downgrade from Goldman Sachs.
Headed into the new trading week, it’s the stock charts of Centurylink (NYSE:CTL), Campbell Soup Company (NYSE:CPB) and Bristol-Myers Squibb (NYSE:
BMY) worth the closest technical looks. Here’s why.
Campbell Soup Company (CPB)
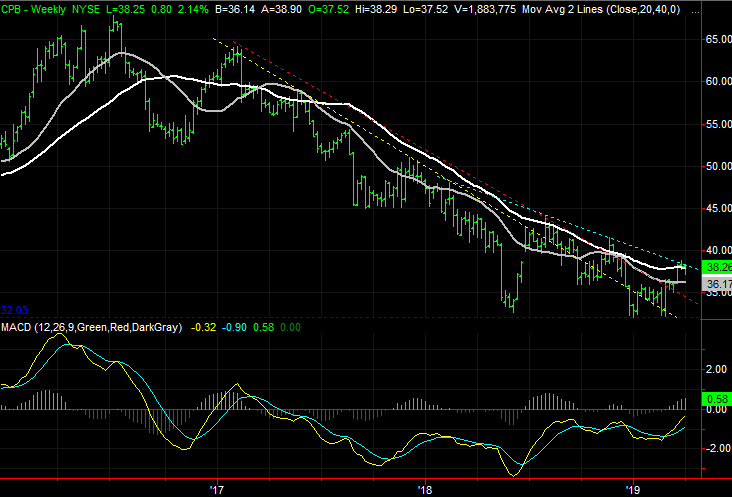
Campbell Soup Company has been a miserable performer since the middle of 2016, losing nearly half of its value on a combination of company and industry problems. The last several attempts at a technical turnaround have gotten nowhere.
As of Friday, though, the stock has shown the most hope for a new, prolonged uptrend than we’ve seen in years. A few more good “up” days could do the trick.
Click to Enlarge
• That renewed attempt has taken shape following a potential double-bottom around $32, plotted with a blue dashed line on both stock charts. That’s the first time since 2017 we’ve not made lower lows.
• As the weekly chart indicates, slowly but surely Campbell Soup shares are pushing above falling resistance lines. The one in play now, plotted in an aqua color, is the last one to hurdle.
• Though encouraging, this reversal — given the stock’s long-lived history — may be one that takes a few weeks to complete, being more of a process and less of an event.
Bristol-Myers Squibb (BMY)
It’s rare for a blue chip like Bristol-Myers Squibb to slip into a long-term downtrend in the middle of a bull market … rare but not unheard of. Indeed, the one BMY stock has been suffering since mid-2016 has become so well-developed it’s taken on a life of its own. Moreover, as overdue as it looks and feels like a bounce may be, one more stumble could drag Bristol-Myers under well-established floor and further accelerate the selling.

Click to Enlarge
• In the meantime, Bristol-Myers Squibb has made increasingly lower lows.
• Though the $46 area so far has proven to be support, the selling volume has soared just within the past month. That’s a new development, suggesting the sellers are just now starting to crawl out of the woodwork, perhaps fearing the future is grim.
Centurylink (CTL)
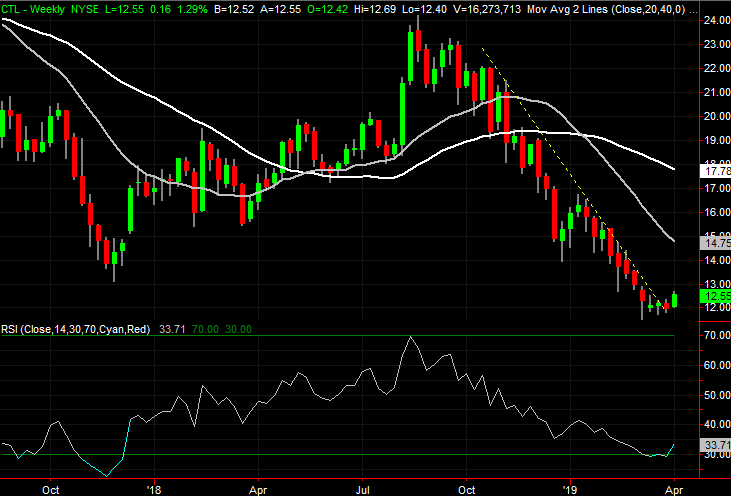
Finally, Centurylink has been shellacked since October, guided lower by a well-defined falling resistance line. The bleeding started to stop in March, however, and as of last week the healing appears to have begun. The effort needs to be a little more solidified, but a lot of bullish clues are starting to become evident. Equally evident is that the bears seem to have overshot their target.
The falling resistance line is plotted in yellow on both stock charts. While unable to break above it through February, the sideways action last month was enough to break the ceiling.
Click to Enlarge
• Zooming out to the weekly chart, we can see the RSI indicator broke below the oversold threshold at 30 last month, but more important, pushed back above it last week. That recovery is a key buy signal.
• Although the purple 50-day moving average line could prove to be resistance at $13.12, given the scope of the selloff, it’s the gray 100-day and white 200-day moving average at $15 and near $18 that are the more plausible technical ceilings.
As of this writing, James Brumley did not hold a position in any of the aforementioned securities. You can learn more about James at his site, jamesbrumley.com, or follow him on Twitter, at @jbrumley.