It was neither easy nor convincing, but the bulls mustered a modest gain on Monday, resisting the weight of the overdone rally that has materialized since late December. The S&P 500 was up 0.1% yesterday, albeit on uncomfortable low volume.

Netflix (NASDAQ:NFLX) led the way with its 4.7% gain, at least partially sparked by reports that it was establishing a new content production facility in New York. Rite Aid (NYSE:RAD) set a major bullish tone for the market though, gaining more than 10% in response to news that it was not only still willing to sell conventional tobacco cigarettes, but was also willing to add CBD-based skus to its product mix.
At the other end of the spectrum, Tesla (NASDAQ:TSLA) shares fell nearly 4% after a video of a parked Model S explosion in China began to circulate, underscoring a downgrade from Evercore ISI analyst Arndt Ellinghorst.
Headed into Tuesday’s trading though, it’s the stock charts of Fifth Third Bancorp (NASDAQ:FITB), Marathon Oil (NYSE:MRO) and IHS Markit (NASDAQ:INFO) that merit closer looks. Here’s why, and what to look for.
IHS Markit (INFO)
IHS Markit isn’t exactly a household name, though it’s likely that most households benefit from the service it provides. The company collects and disseminates data, including investment-related data, to a variety of customers including clients that pass the information along to individual users.
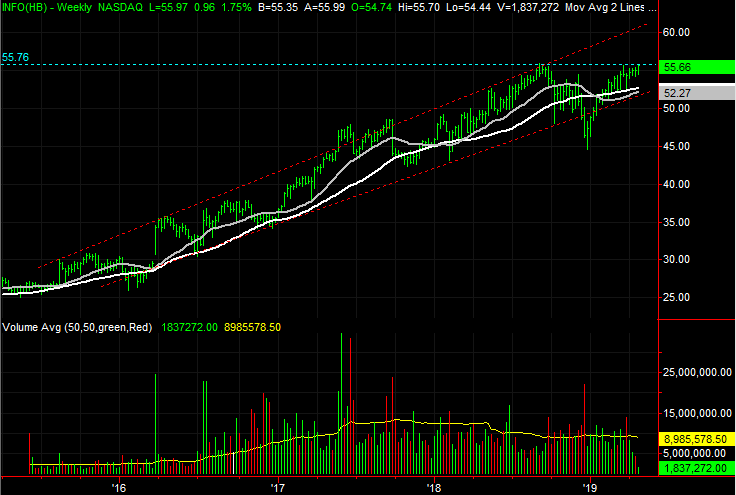
Like most stocks, INFO tumbled late last year, only to snap back early this year. That rally has since stalled but did so at a familiar level, and did so with an encouraging backdrop. One more good day following yesterday’s bullish jolt could get IHS Markit shares over a major hurdle.
Click to Enlarge
- That hurdle, of course, is the ceiling at $55.66, plotted with a dashed blue line on both stock charts. INFO stock has peaked there several times since September, including yesterday.
- While not up and above that key resistance level, INFO has tested that ceiling with some clear help. Shares pushed up and off the white 200-day moving average line a couple of different times last month.
- Zooming out to the weekly chart we can see INFO stock is still near the lower edge of a long-term rising trading range, plotted with red dashed lines. The rally, if it gets going, could run to the upper boundary around $62 before hitting a major headwind.
Fifth Third Bancorp (FITB)
Back on March 13, FITB stock was not only about to break above a horizontal ceiling at $28.07, but it was also close to pushing above its 200-day moving average.
Given the buildup of momentum behind the effort and the scope of the lines on the verge of being hurdled, it was worth a closer look.
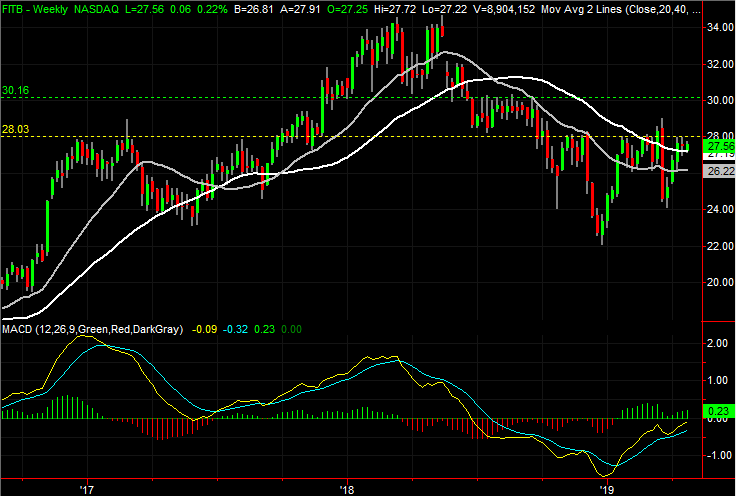
FITB stock ended up breaking above that resistance, and even rallying for a couple more days, turning heads. It all fell apart (and then some) during the latter half of March, however, mostly for external reasons. In the meantime, Fifth Third shares have worked their way back to a familiar line in the sand, but once again are hesitant to hurdle it.
Click to Enlarge
- The line in the sand is once again $28.07, where FITB peaked a couple of times last week and the week before.
- Although it’s not over the big technical ceiling, over the course of the past few weeks we’ve seen more bullish volume than bearish volume. There may be more would-be buyers waiting in the wings than it seems on the surface.
- If the resistance around $28 is cleared, the next most likely upside target is around $30.16, where Fifth Third found resistance for several weeks in the middle of 2018.
Marathon Oil (MRO)
To be clear, Marathon Oil had some help getting past a relatively important resistance level on Monday. A sharp rise in the price of crude gave the stock a shove.
Nevertheless, MRO was already positioning not just to make such a move when we last looked at it back on March 21, but it remains better positioned than most other energy names now to actually do something with yesterday’s tailwind.
Click to Enlarge
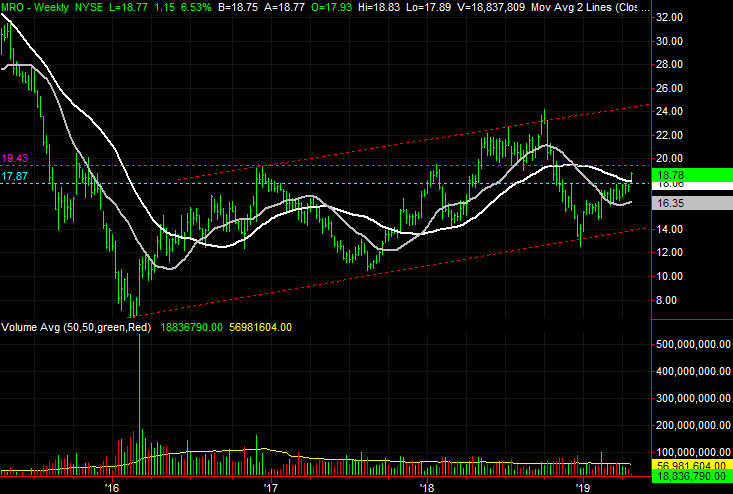
- Headed into the end of last week, Marathon had been squeezed into the tip of a converging wedge pattern. That squeeze ultimately launched MRO out of the narrowing range in a bullish direction, shoving it above the white 200-day moving average line in the process.
- In the weekly timeframe, it’s easy to tell this recent action is all part of the movement within a well-defined trading range. There’s still a big span between the current price and the upper edge of the range.
- While Marathon appears to be more willing to do its own thing than be subject to the ebbs and flows in oil and gas prices, headlines and oil-related news could still make or break this rally effort.
As of this writing, James Brumley did not hold a position in any of the aforementioned securities. You can learn more about James at his site, jamesbrumley.com, or follow him on Twitter, at @jbrumley.