Stocks started yesterday’s action out on a firmly bullish foot, but didn’t end the session quite as enthused. Up as much as 1.44% near the middle of the day, the S&P 500 was dialed back to a gain of only 0.89%. It’s not clear how much conviction the bulls have, or don’t have.

Leading what was left of the bullish charge was Nokia (NYSE:NOK), up nearly 4% mostly as a snapback from nearly a month’s worth of strong selling. A potential end to trade worries was inspiring enough to cut into the stock’s 18% slide since late April. Pinterest (NYSE:PINS) was the big winner for the regular session though, rallying nearly 8% headed into its post-close earnings report that turned into a 15% loss in after-hours action. This year’s revenue outlook was a major letdown.
At the other end of the spectrum, iron ore miner Vale (NYSE:VALE) fell more than 4% after it warned yet-another one of its mines is in danger of collapsing.
None of those names are top trading prospects headed into the final trading day of the week, however. Rather, it’s the stock charts of PPL (NYSE:PPL), Electronic Arts (NASDAQ:EA) and Tyson Foods (NYSE:TSN
) that are shaping up as the best bets. Here’s what should happen next.
PPL (PPL)
Utility stock PPL had plenty of help moving lower yesterday. The entire sector lost ground as traders migrated out of the safety they tend to offer and back into riskier sectors.
PPL was unique, however, in the sense that the stumble carried shares to new multi-week lows, and did do on lots of volume. There’s a chance any budding pullback could be caught before it spins out of control, but there’s also a chance it might not find support at that floor.

Click to Enlarge
- The floor in question is currently at $26.80, plotted with a yellow dashed line on both stock charts. That line tags the last two major lows.
- Yesterday’s weakness also took shape on unusually high volume, yet wasn’t prodded by the news. This could be a hint there are more sellers waiting in the wings to see a little more trouble before bailing out.
- On the flipside, regardless of what happens from here, new technical ceilings have been defined. The upper one of those is as high as $37, lining up with the string of higher highs seen in the latter half of last year. It just may not matter for a while.
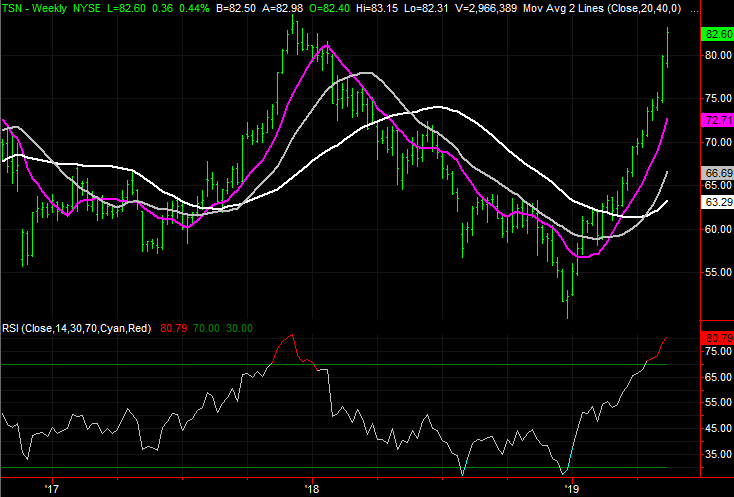
Tyson Foods (TSN)
It’s tempting to want to get on the Tyson Foods train. Shares are up a stunning 65% from their late-December low, and still appear to be accelerating. The higher it flies, the seemingly stronger it gets.
The rally is setting up to be more of a trap, however, luring in the last of unsuspecting investors before the buyers unload into that strength and kickstart a pullback. It hasn’t started yet, but we saw a subtle hint in yesterday’s bar that suggests we could be at the pivot point. And, the future is primed for selling.
Click to Enlarge
- As of yesterday’s close, TSN shares are 31% above the white 200-day moving average line. That’s even more divergence than we saw in late-2017 when a massive selloff took shape.
- The shape of Thursday’s bar is also a concern. The open and closer were in the bottom half of the intraday high/low range, suggesting yesterday was the point that transitioned from a net-buying to net-selling environment.
- Although yesterday’s bar is a red flag, it’s only confirmed by a move lower, and ideally an open within Thursday’s intraday range followed by a close below yesterday’s low.
- The weekly chart’s RSI indicator has been into overbought territory for a while, which doesn’t happen often, and didn’t last long the last time we saw it happen.
Electronic Arts (EA)
Electronic Arts is one of those names investors seem to know they punished too severely in the latter half of last year, but have been hesitant to undo that damage.
Traders are increasingly willing to test the waters for a potential turnaround though. The repetition of this effort is telling in and of itself, but the simple act of forcing more and more ‘trial balloons’ is chipping away at the big technical ceiling as well. One more good day could get EA over the hump.

Click to Enlarge
- That ‘hump’ is mostly the 200-day moving average line, plotted in white on both stock charts.
- Simultaneously, the major peaks going back to February line up to make a near-term technical ceiling that as of yesterday is being pressured again.
- Zooming out to the weekly chart we can see the Chaikin line is back above zero, and the MACD lines are showing a new bullish divergence. The budding uptrend already has multiple tailwinds.
As of this writing, James Brumley did not hold a position in any of the aforementioned securities. You can learn more about James at his site, jamesbrumley.com, or follow him on Twitter, at @jbrumley.