Just to frustrate investors even more than they already are, the market’s key indices brushed their pivotal 200-day moving average line on Wednesday, and closed right above them rather than breaking below them or pushing well off of them. The S&P 500’s last trade at 2,783.02, down 0.69%, was right in the middle of its narrow daily range, and right at the 200-day moving average line at 2,775.71.

Advanced Micro Devices (NASDAQ:AMD) did the most net damage to the market, falling more than 3% as profit-takers tore into yesterday’s oversized gains. It was China’s electric car maker Nio (NYSE:NIO) that suffered the most noteworthy loss though, falling more than 9% on the heels of a disappointing Q1 that prompted at least one downgrade of the already-struggling company.
Some names managed to make forward progress, but none were as impressive as Cypress Semiconductor (NASDAQ:CY). Shares of the tech company jumped 12% in response to news that it was mulling putting itself up for sale.
Headed into today’s action, however, it’s stock charts of General Mills (NYSE:GIS), Iron Mountain (NYSE:IRM) and PayPal Holdings (NASDAQ:PYPL
) that are worth the closest looks. All three are at the precipice of trade-worthy moves that just need the right nudge.
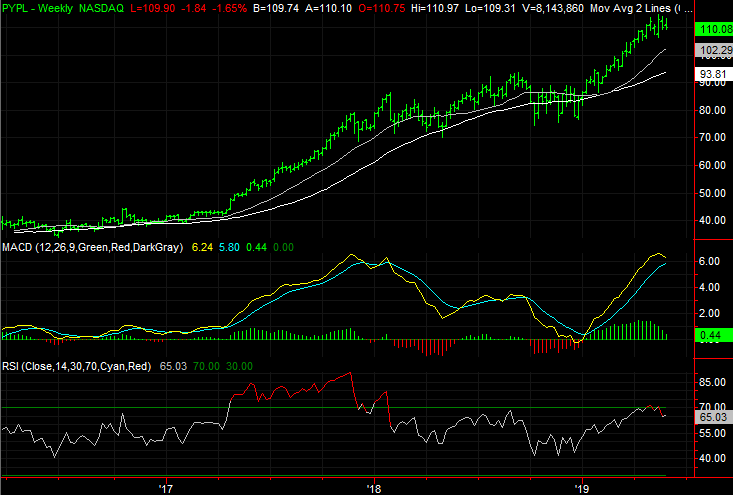
PayPal (PYPL)
PayPal has been on a tear this year. At its current price, even with Wednesday’s sizeable stumble, PYPL stock is up an impressive 44% from its late-December low. It deserves a break.
A deeper, more critical look suggests this chart may have to take a sizeable step back before it begins moving forward again though. In fact, a detailed look at matters suggests the bears have already put that pullback into motion. The trick is simply figuring out where it might stop.
Click to Enlarge
- The swings since late April are clues in and of themselves. Volatility after a prolonged straight-line move often indicates a change of heart. The purple 50-day line is the make-or-break level from here.
- To that end, a couple of the past four trading days have not only been bearish, but they’ve been bearish on above-average volume.
- Zooming out to the weekly chart puts things in perspective. The RSI indicator is now unwinding its overbought condition, but it’s also clear in this timeframe that the divergence so far this year has been overdone.
- The gray 100-day moving average or the white 200-day moving average line are the most likely landing and turnaround levels for any selloff that takes shape from here.
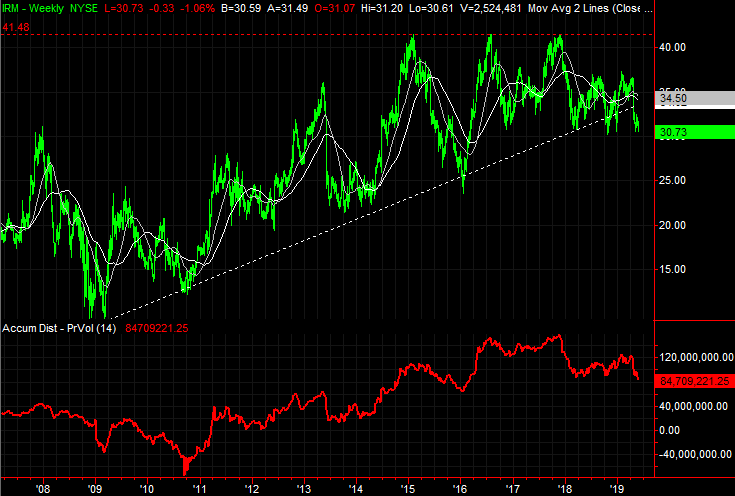
Iron Mountain (IRM)
It’s not a situation most real estate investment trusts find themselves in right now. Then again, Iron Mountain is unlike most REITs. The company is organized as a real estate investment trust, but provides physical and digital storage of documents companies are required to keep.
Regardless of its distinguishing features, recent weakness has dragged IRM to the brink of a critical technical floor, and to within sight of another. And, the weaker it gets, the more sellers crawl out of the woodwork. One or two more rough days could break its fragile floor.
Click to Enlarge
- The line to watch from today on is $30.58, plotted in blue on the daily chart. That was not only Wednesday’s but the key low from a couple of times earlier this year and late last year.
- It’s not overwhelming, but the volume behind the recent “down” days has been above average, and continues to grow. There may be more sellers waiting in the wings.
- Backing out to the weekly chart we can see Iron Mountain shares have actually been fighting a losing battle for years. The rising support line that carries IRM higher from early 2009 has been broken and re-broken since the middle of last year, after failing to make higher highs since 2014.
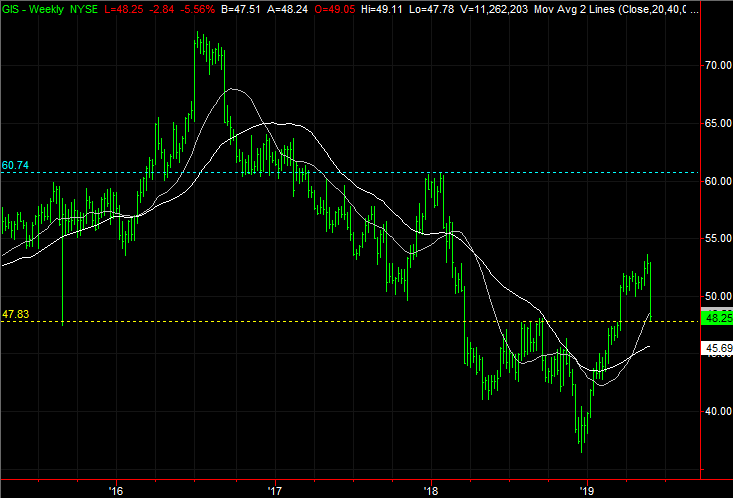
General Mills (GIS)
With nothing more than a quick glance, General Mills looks like it’s untouchable. The stock plunged more than 5% on Wednesday — a big move for a food name — and the volume was heavy. There were a bunch of sellers, and more downside could be in store.
A closer look at the chart and the backdrop, however, hints that yesterday’s big setback may actually be a buying opportunity. The bleeding stopped exactly where it was supposed to, and where one would normally expect to see a reversal effort.
Click to Enlarge
- The key line is the 100-day moving average line, plotted in gray on both stock charts. GIS only had to kiss it for the buyers to get off the sidelines.
- Underscoring the bullish argument is the possibility that General Mills only had to close the gap left behind in March. The lower edge of that span is highlighted with a yellow line on both stock charts.
- Whatever’s in the cards, it’s apt to happen soon. How shares respond today will suggest much about the true direction of the undertow here.
As of this writing, James Brumley did not hold a position in any of the aforementioned securities. You can learn more about James at his site, jamesbrumley.com, or follow him on Twitter, at @jbrumley.