Once again the market managed to fight its way out of the red and back into the black, with the S&P 500 ending the session up 0.1% to close at 2,945.83. That’s another record.

Leading the charge was Shopify (NYSE:SHOP), which shot up nearly 8% after posting impressive first-quarter numbers and following them up with an equally-impressive full-year outlook. The company earned 9 cents per share versus analyst expectations of 5 cents. General Electric (NYSE:GE) was a top performer too, up more than 4% on an encouraging first-quarter of its own.
Holding the market back more than any other name was Alphabet (NASDAQ:GOOG, NASDAQ:GOOGL), which fell nearly 8% after missing last quarter’s sales estimates.
But despite all of yesterday’s excitement, heading into today’s session, it’s the stock charts of American International Group (NYSE:AIG), Charles Schwab (NYSE:SCHW) and Activision Blizzard
(NASDAQ:ATVI) that are worth the closest looks from traders. Here’s why.
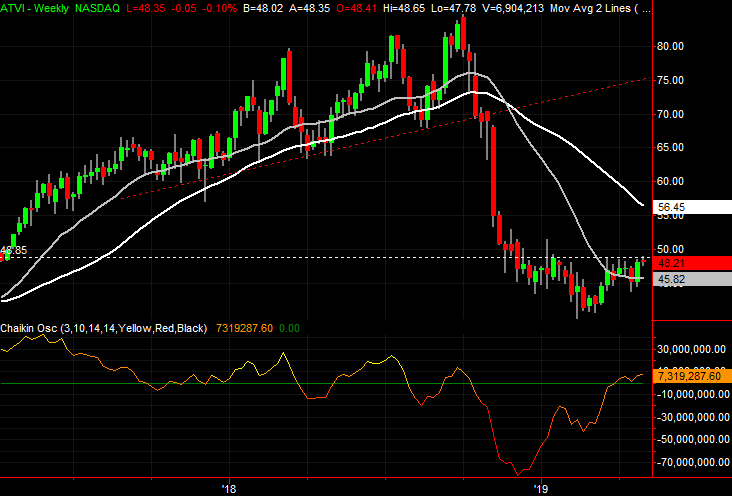
Activision Blizzard (ATVI)
When ATVI stock broke down in October of last year and it broke down hard. Slipping under the support line that had held it up for the better part of 2018 started a landslide. Few would argue that it wasn’t overdone, but nobody was willing to be the first to try and catch a falling knife.
However, the knife appears to not only have landed now, but it appears to be on the rise again. There’s just one more hurdle to move past before the masses will likely feel safe enough to power a rebound rally.
Click to Enlarge
- The line in question is around $48.80, plotted with a white dashed line on both stock charts. ATVI stock has peaked there several times this year, including this week.
- Underscoring the bullish case is the first higher low seen since late last year, which was provided courtesy of new support at the purple 50-day moving average line in mid-April.
- It’s not the only gap to be filled, but if Activision Blizzard can get over the hump, there’s a big gap from November that’s beckoning ATVI back to the $62 area.
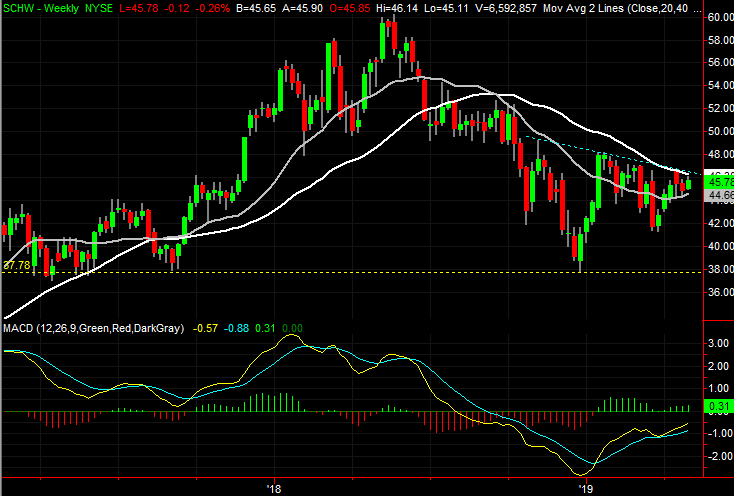
Charles Schwab (SCHW)
With just a quick glance, it only looks as if SCHW stock remains in a shallow, choppy downtrend. There’s more underway here than it seems on the surface, however. Slowly but surely the bulls are moving toward a breakout thrust, having laid the groundwork for it over the course of the past several months.
The good news is, the remaining lines in the sand are easily identifiable, and there’s little left to impede a recovery move if those ceilings can just be cleared.
Click to Enlarge
- One of the lines in question is the resistance that has tagged all the key highs going back to November, plotted in blue on both stock charts. The other likely ceiling is the white 200-day moving average line.
- Bolstering the bullish case is the shape of the chart leading into the latest test of that technical resistance. SCHW stock logged its first higher low in months in March, and the pattern since November is an (admittedly sloppy) upside-down head-and-shoulders pattern that should fuel any breakout.
- It’s not shown or evident on either of the stock charts, but small and mid-cap financial stocks are finding more bullish traction than most other groups. That’s boosting Schwab shares as well.
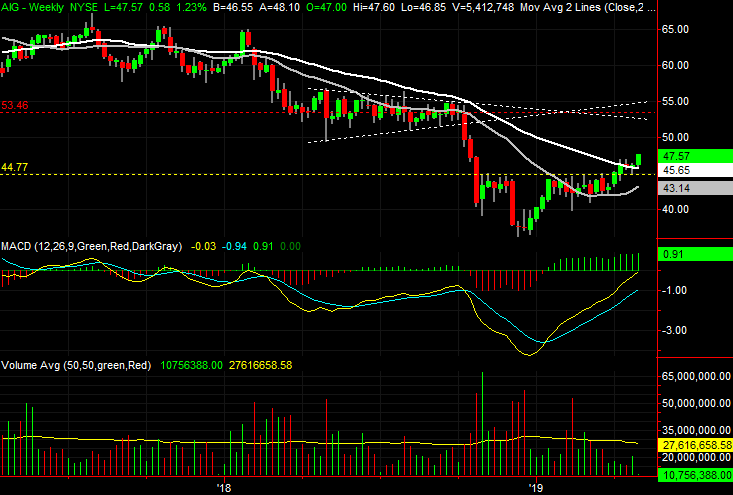
American International Group (AIG)
Several months ago American International Group was featured as a potential breakout candidate, if it could shatter the technical ceiling that had been holding it down since November. That never happened. Although AIG took several more shots at that resistance, it never buckled.
That has changed within the past month, and then some. Not only has American International broken through a major technical ceiling, it has broken above a key moving average line after finding resistance at that line just a few days ago. There’s little left to hold it back now.
Click to Enlarge
- The technical ceiling in question is around $44.90, plotted in yellow on both stock charts.
- As of Monday, AIG is above the 200-day moving average line, plotted in white on both stock charts. For good measure, AIG stock put some distance between itself and that long-term line on Tuesday.
- Underscoring the recent breakout thrust is a growing level of daily volume behind the advance.
- Although it’s easy to overlook, bolstering the case that the move above the 200-day line is a key event is that the very same 200-day moving average line briefly quelled the rally effort in mid-April.
As of this writing, James Brumley did not hold a position in any of the aforementioned securities. You can learn more about James at his site, jamesbrumley.com, or follow him on Twitter, at @jbrumley.