The market may have popped on Tuesday, but it wasn’t a terribly impressive move. The S&P 500’s 0.85% gain still left it below some key technical lines, and the volume behind the gain was tepid.

Array Biopharma (NASDAQ:ARRY) was the big winner, gaining 23% following news that its colon cancer regimen met its endgoals in a late-stage trial. Among the more familiar, large and market-moving names though, the 2.5% gain Advanced Micro Devices (NASDAQ:AMD) logged was less thrilling though more noteworthy. The partial alleviation of trade tensions, particularly surrounding tech, released the hold that had stymied most of these names on Monday.
At the other end of the spectrum, retailer Kohl’s (NYSE:KSS) was crushed, losing more than 12% of its value on the heels of lousy Q1 print that forced the company to dial back its full-year profit forecast … weakness that wasn’t necessarily mirrored by other retailers.
None of those names are compelling trade prospects as we head into the midpoint of the week, however. Rather, it’s the stock charts of TJX Companies (NYSE:TJX), Lamb Weston Holdings (NYSE:LW) and Oracle Corporation (NYSE:ORCL) that are worth the closest look. Here’s that look.
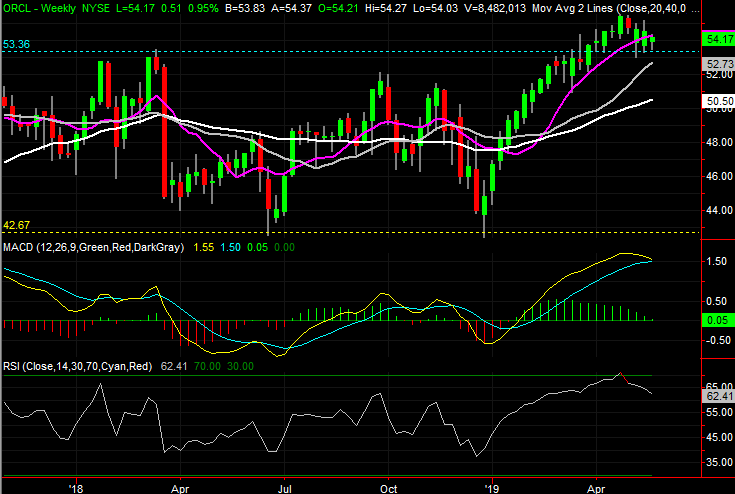
Oracle Corporation (ORCL)
Oracle shares have dished out an impressive runup since late last year, and for the most part have sidestepped the recent market turbulence.
Take a closer look at both stock charts, though, and it’s clear that momentum is slowing. Indeed, it has stopped and it is teetering on a reversal back into a downtrend. One or two more rough days could put shares into a more pronounced selloff.
Click to Enlarge
- The most important line to watch now is the one that tags all the key lows going back early February. It’s plotted in yellow on the daily chart. It’s at $53.59 right now.
- Although that floor is still intact, ORCL has already pulled below the purple 50-day moving average line a couple of different times.
- Zooming out to the weekly chart of Oracle, all the key bearish clues are lining up. The RSI line only had to kiss the 70 level last month before starting to unwind, and we could see a bearish MACD cross before the end of the week. That latter event could spur some programmed selling.
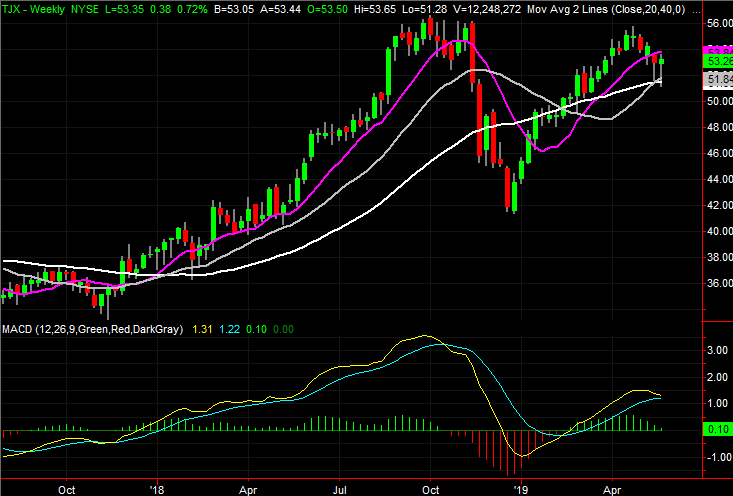
TJX Companies (TJX)
In the middle of yesterday’s trading session, TJX Companies shares looked like they were in real trouble. Already trending lower from a late-April peak, fresh pressure was being put on the white 200-day moving average line. Despite the earnings beat and raised outlook, traders saw matters through a bearish lens … right up until they didn’t.
By the end of the day, TJX shares were back in the black, having pushed up and off of the critical 200-day line. The big intraday swing backed by a clear volume surge suggesting a major turning of the tide. There’s just one more hurdle for the bulls to clear, though it’s a huge one.
Click to Enlarge
- The big hurdle in question is actually the combination of the blue 20-day moving average line at $53.88 as well as the purple 50-day moving average line at $53.57.
- The scope of the swing itself is telling, indicating a sweeping change of heart, prompted by news. Such reversals tend to go somewhere.
- Almost just as likely, though, is a breakdown. Should the bears decide to retest the 200-day line at $51.49 (and the gray 100-day moving average line right below it at $51.18) and it fails to hold as a floor, the bearish momentum in place since late April could pile-drive the stock following a failed reversal.
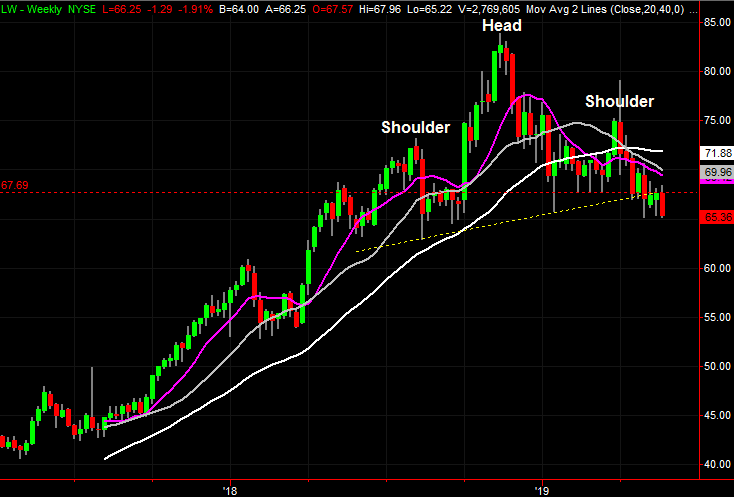
Lamb Weston Holdings (LW)
Finally, when we last looked at Lamb Weston Holdings a month ago, we cautioned that while it had not yet broken below a major support line, the undertow was alarmingly bearish. The selling volume was picking up the pace as well.
It turned out to be a worthy worry, though only for a few days. While LW stock edged its way back higher, it met a familiar technical ceiling to end up breaking under any of what could have been technical floors. A new one has been made in the meantime, but it’s not great, and also starting to crumble.
Click to Enlarge
- The newest technical floor is right around $65.17, plotted in blue on the daily chart. That’s more or less where Lamb Weston has found support since the beginning of the month.
- Although there’s a floor in play now, both of the more meaningful support lines plotted in red and yellow on both stock charts have been snapped.
- It’s easy to overlook, but the purple 50-day moving average line is now below the white 200-day moving average … a so-called “death cross” that suggests more selling is ahead.
- It’s only readily evident on the weekly chart, but with the break under the yellow “neckline,” Lamb Weston appears to have just completed a bearish head-and-shoulders setup.
As of this writing, James Brumley did not hold a position in any of the aforementioned securities. You can learn more about James at his site, jamesbrumley.com, or follow him on Twitter, at @jbrumley.