Once the bulls had to push back or risk being rolled over, they pushed back. Stocks logged their first daily win in five sessions on Thursday, with the S&P 500’s 0.38% advance solidifying a market-wide turnaround effort. It’s still not rock-solid, but it’s a start.

Ford Motor (NYSE:F) did a fair amount of the heavy lifting, up nearly 3% mostly on the heels of news that it would be shuttering several of its European facilities, where it struggles to turn a profit. However, iQiyi (NASDAQ:IQ) logged a much bigger gain jumping more than 10%. The so-called “Netflix (NASDAQ:NFLX) of China” announced it would be partnering with China Unicom to develop 5G terminal devices.
Nokia (NYSE:NOK) was the only notable to name to lose ground, though its 1% setback wasn’t nearly enough to infect other names. The telecom-tech giant continues to grapple with a technical headwind.
That headwind isn’t reliable enough to make NOK a top-notch bearish bet though. In fact, it’s the stock charts of Huntington Bancshares (NASDAQ:HBAN), Goldman Sachs Group (NYSE:GS) and Centurylink (NYSE:
CTL) that look best positioned for major moves in the foreseeable future.
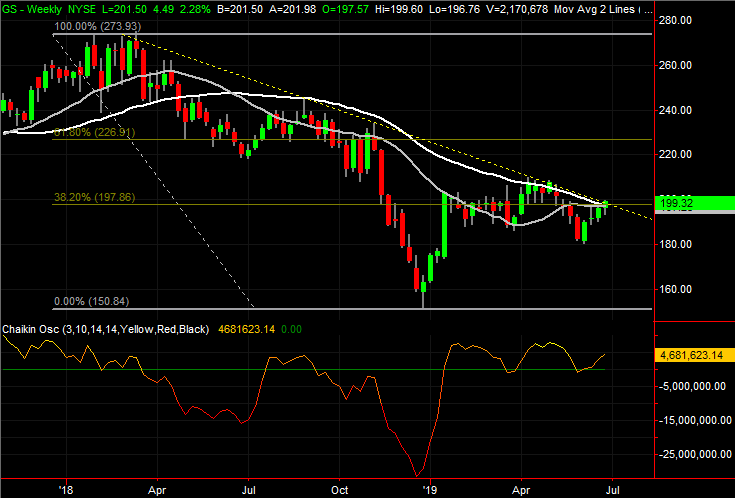
Goldman Sachs Group (GS)
Goldman Sachs Group isn’t a name that has been on many radars of late. It is a bank, but isn’t. It’s got a new CEO, but it’s business-as-usual. Most investors appear to be taking a wait-and-see approach, and have shelved it indefinitely until there’s a clear reason to take it off the shelf and make a call.
It may be time to dust it off and take a look though. GS stock has slowly and quietly tiptoed toward a major breakout point. It has hinted at this test before, to no avail. This time is different, however, and one or two more good days could change the paradigm in a big way.
Click to Enlarge
- The resistance line in question is plotted in yellow on both stock charts. It tags all the major peaks going back to the early part of last year.
- Simultaneously, Goldman Sachs is testing the white 200-day moving average line as a ceiling. It failed to clear it in April, but it is getting another shot at it right now.
- There’s more to the current turbulence around $198 than readily meets the eye. There’s also a major Fibonacci retracement line near that level. If Goldman shares can get cleanly past it, there’s little else to stand in its way.
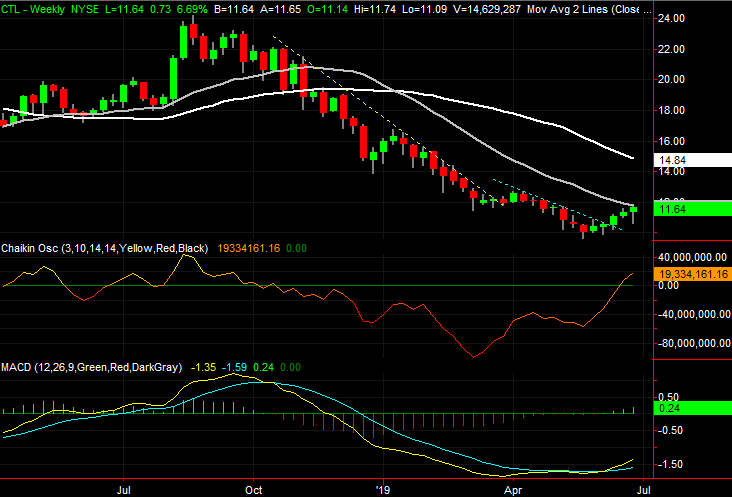
Centurylink (CTL)
A week and a half ago, we pointed out Centurylink shares were in rebound mode. Falling resistance lines were being broken, and the stock was working on a break above the pivotal 50-day moving average line.
CTL shares punched through that ceiling the same day, and though they fell back under it again a few days later, the bulls pushed it back into place on Thursday. In fact, the buyers shoved CenturyLink stock to its highest high and highest close in weeks. That level of persistence is encouraging, though a new technical ceiling has come into view.
Click to Enlarge
- With the purple 50-day moving average line in the rearview mirror again, CTL is within striking distance of the gray 100-day moving average line.
- Zooming out to the weekly chart we can see the Chaikin line has not only crossed above zero, but we have a new MACD buy signal in place. The weekly view also better illustrates how CenturyLink is breaking down previous resistance levels.
- Although the bigger-picture momentum is impressive, near-term volatility can be expected. Even if the 100-day line is hurdled, it may not necessarily stay hurdled.
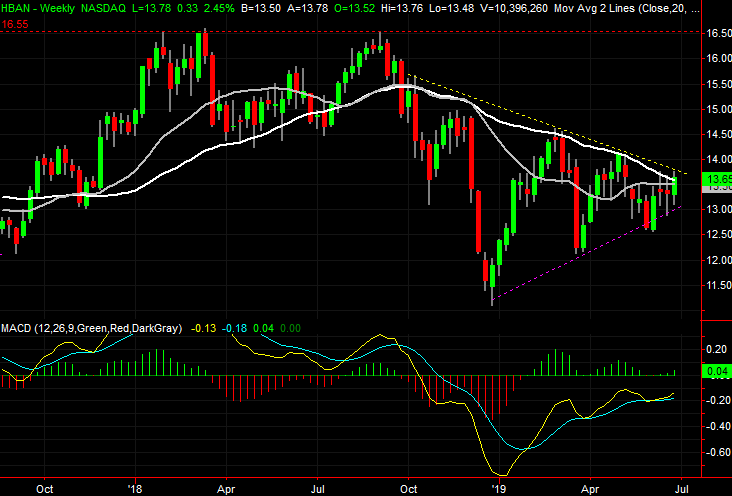
Huntington Bancshares (HBAN)
Finally, Huntington Bancshares — like most bank stocks — have been pressured lower since late last year on concerns that falling interest rates would sap bank profitability. Most banking names have since served up glimmers of hope, though only erratically. It would be easy to not get excited about any bullish thrusts, instead, interpreting them as headfakes.
The headfakes HBAN is throwing, however, are clearly different than the ones most of its banking peers are making. Not unlike Goldman Sachs, HBAN is close to punching past a huge technical resistance level, and it’s doing so with a significant amount of bullish backing.
Click to Enlarge
- The key to a breakout is a move above the $13.70 area. The resistance line that connects all the recent peaks is there, plotted in yellow on both stock charts. And, like GS, that’s also where the white 200-day moving average line is … the same line that quelled February’s rally.
- Noteworthy is the amount of bullish volume that has materialized in just the past few days. It suggests there are a lot of would-be bulls waiting in the wings.
- It would need a lot of marketwide help to get there, but if Huntington Bancshares can break out of their converging wedge, the most established technical ceiling is last year’s double-top around $16.56.
As of this writing, James Brumley did not hold a position in any of the aforementioned securities. You can learn more about James at his site, jamesbrumley.com, or follow him on Twitter, at @jbrumley.