Wednesday’s 0.2% setback for the S&P 500 still wasn’t enough to push it past the point of no return. But, anything remains possible at this point … good or bad. More than anything, traders are losing interest.

Teva Pharmaceutical (NYSE:TEVA) was a proverbial problem child, off more than 4% after a judge rejected its initial settlement offer to end an opioid liability case against the company. Chesapeake Energy (NYSE:CHK) was the bigger overall drag, falling more than 7%, mostly driven by industry pricing weakness. General Electric (NYSE:GE) helped keep the weakness to a minimum, up 1.5% as investors increasingly buy into the turnaround story.
None are great picks headed into Thursday’s trading though. Rather, it’s the stock charts of Philip Morris International (NYSE:PM), Twitter (NYSE:TWTR) and H & R Block (NYSE:HRB) that merit the closer looks.
H & R Block (HRB)
Shares of H & R Block are, in simplest terms, at a crossroads.
The fact that HRB was able to recover and rebound after being on the verge of a pretty significant selloff (as recently as March) confirmed there’s a rather significant floor around $23.65, plotted in blue on both stock charts. However, this week’s action also confirms there’s a major ceiling that stands in the way of higher highs. Although the stock could still fall on either side of the fence, with two years’ worth of consolidation ready to be unleashed, the possible breakout thrust is worth a closer look.

Click to Enlarge
- The ceiling in question is, of course, the $29.20 level marked in red on both stock charts. That’s around where H & R Block stock peaked several times since late 2017.
- Although none of the other attempts to hurdle $29.20 have been effective, this one differs in that the last couple days have made big gains on big volume.
- Perhaps the most bullish argument here isn’t what is, but what isn’t. The weekly chart’s RSI indicator hasn’t crept into overbought territory yet, leaving room for more upside before the profit-takers push back.
Philip Morris (PM)
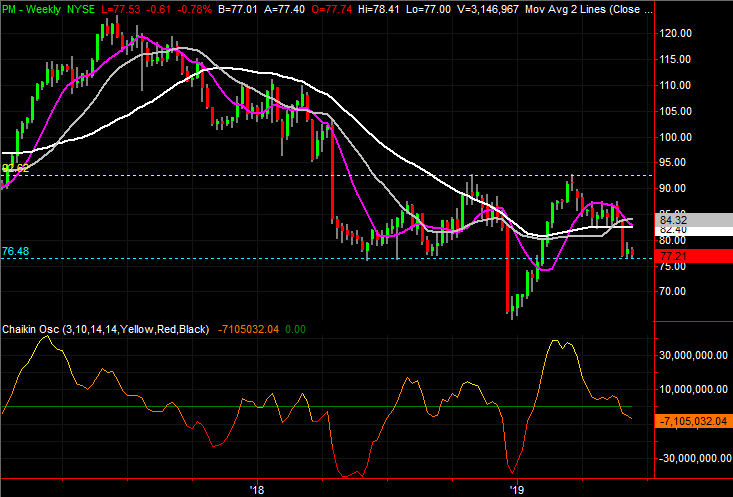
With nothing more than a passing glance at Philip Morris, it looks as if it has averted trouble. And, perhaps it has. The weakness seen late last month has been quelled, with a technical support level taking shape around $76.70.
This may only be a short pause before the selloff resumes again, however. One more misstep could push PM shares over that cliff’s edge.
Click to Enlarge
- The way the highs and lows over the course of the past week and a half have made a pretty well-defined box shape is telling in itself. It could be considered a bearish continuation pattern that lets the sellers regroup.
- The floor at $76.70 is more meaningful than the past few days would suggest. That same level was a key floor a trio of times in 2018, making it a more important support area now.
- Still, until that floor actually fails to keep Philip Morris stock propped up, there’s still a chance at a rebound.
Twitter (TWTR)
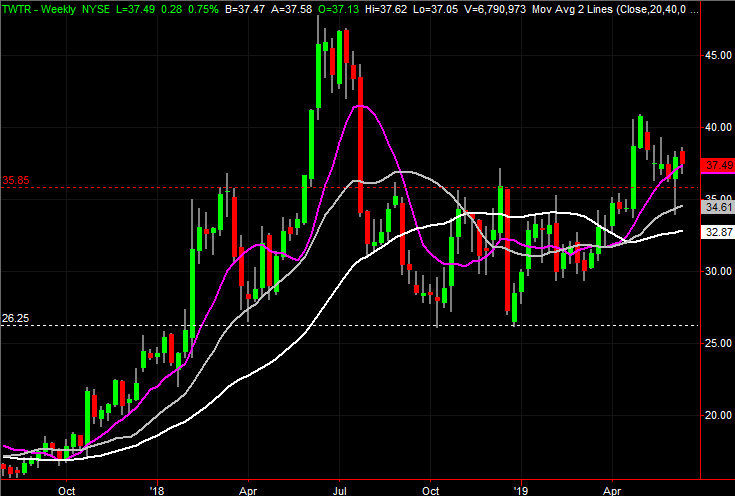
Several times earlier this year Twitter was featured as a budding bullish candidate. Although choppy, the fact that the buyers were repeatedly making an attempt to reclaim ground lost in the middle of last year was encouraging. The breakout move finally took shape in April, though in the worst possible way. That is, a huge gap was left behind; traders generally don’t like to leave gaps unfilled.
Sure enough, that gap was filled in the meantime, with last month’s weakness. The spot with which the bounceback has taken shape, however, suggests a whole new trading range has been established that will serve as a Launchpad for the move to the next higher level.
Click to Enlarge
- All it took was a kiss of the gray 100-day moving average line in early June (highlighted) to close the gap left with April’s surge.
- This week so far, the purple 50-day moving average line and the blue 20-day moving average line have acted as a technical floor, holding TWTR above a key technical ceiling near $37.20, plotted in red.
- The next level to watch is $42.14, where the upper boundary of July’s bearish gap is found.
- It’s more readily evident on the weekly chart, but with the recent move higher, the old trading range between $35.80 and $26.25 has been left in the rearview mirror.
As of this writing, James Brumley did not hold a position in any of the aforementioned securities. You can learn more about James at his site, jamesbrumley.com, or follow him on Twitter, at @jbrumley.