Any investors counting on the beginning of a new trading week to usher in some relief from last week’s strong selloff are thus far disappointed. The S&P 500 lost another 0.28% on Monday, falling further below its key 200-day moving average line.

Leading the charge were Facebook (NASDAQ:FB), Alphabet (NASDAQ:GOOG, NASDAQ:GOOGL) and Amazon (NASDAQ:AMZN), down 7.5%, 6.1% and 4.6%, respectively, in response to renewed chatter that the U.S. government is still weighing antitrust efforts for them, and all major tech names.
Yet, there were more advancers than decliners on Monday, pointing to the unevenness of the weakness. Most notable among the winners was the 23.8% jump from Cypress Semiconductor (NASDAQ:CY). Shares of the tech company soared following word that Infineon had officially made a $10 billion acquisition offer.
None are great trading prospects headed into Tuesday’s session, however, as too much inconsistent volatility is in the cards. Rather, it’s the stock charts of Advance Auto Parts (NYSE:AAP), Western Union (NYSE:WU) and Broadcom
(NASDAQ:AVGO) that are worth the closest looks. Here’s what most interesting about each.
Broadcom (AVGO)
Broadcom may have mustered a gain yesterday while the overall market took as step back. But, don’t be fooled. AVGO shares slipped into trouble last week, and have been unable to dig their way out of it. Perhaps worse, it has been verified by a failure to move back above the make-or-break line that failed as a floor last week.
The one remaining support level also happens to be former technical ceiling.

Click to Enlarge
- Last week, Broadcom shares fell below their white 200-day moving average line. They’ve now tried a couple of times to move back above it, but only had to kiss that line on Monday to peel back.
- Zooming out to the weekly chart we can see the new floor, plotted in red on both stock charts, used to be a floor that tagged some major peaks.
- If that support line fails, the next most likely floor is the support line, plotted in blue, that tags the major lows from 2018.
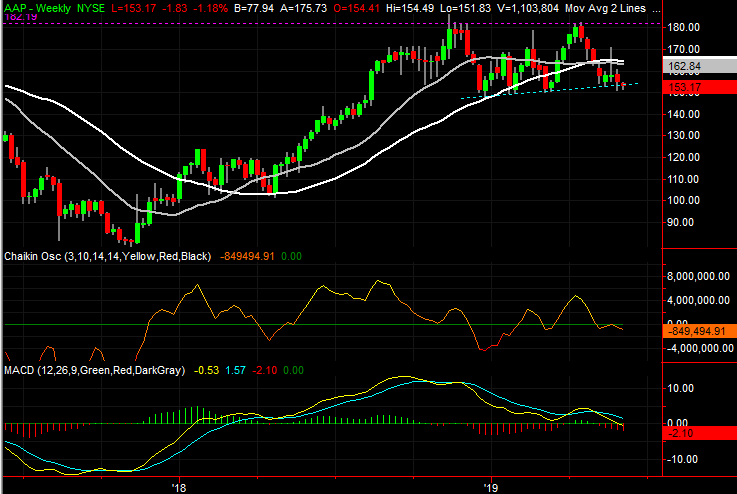
Advance Auto Parts (AAP)
The last time we looked at Advance Auto Parts back in early March, it was in trouble. The 200-day moving average line was on the verge of breaking down as a floor, and shares were in the shadow of a huge sell signal. That breakdown ended up taking shape, but not decisively. In fact, by early April, AAP shares were at an even higher high than they were with the big sell signal … a key pivot bar.
There was a method to the madness the whole time though. That is, a major technical floor was being established. It was validated even further late last month, and as of yesterday has taken the biggest chunk out of that floor yet.
Click to Enlarge
- The floor in question is plotted in blue on both stock charts, lining up all the key lows from near the end of last year.
- Advance Auto Parts has already fallen below last month’s low, marked with a yellow line on the daily chart.
- Although there’s room for the bulls to take a couple more shots from here, if and when the purple 50-day moving average line is able to cross under the white 200-day moving average line, that so-called “death cross” will cast a bearish shadow on all future movement.
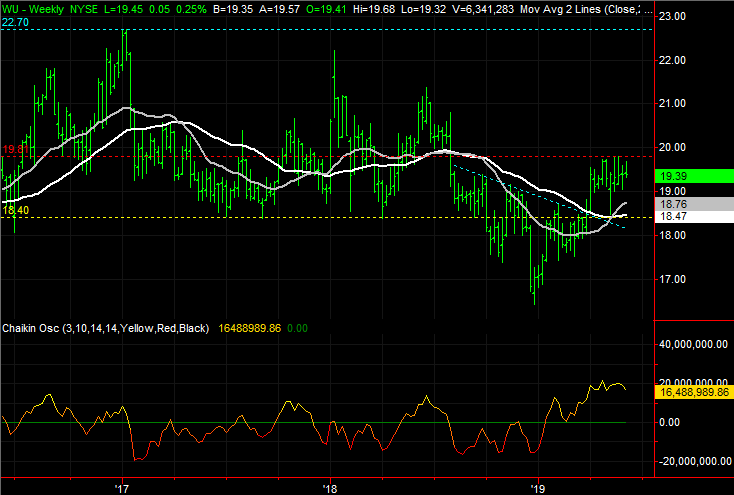
Western Union (WU)
Finally, with nothing more than a passing glance at the chart, it looks like Western Union shares might be slipping into a pullback. And that may well be the case. A second, closer look at WU, however, says there’s still hope for a breakout on the table, if the stock can clear just one more hurdle.
Click to Enlarge
- The two big bullish hints here are the two times the key moving average lines have served as support, spurring higher highs. Both instances are highlighted on the daily chart.
- The bounce off of the white 200-day moving average line in early May is made even more significant by the fact that the same $18.40 level was a floor multiple times in 2017 and 2018. That floor is plotted with a yellow line on both stock charts.
- The big ceiling, of course, is the $19.76 area where Western Union has peaked several times since late April but has been unable to move above thus far.
As of this writing, James Brumley did not hold a position in any of the aforementioned securities. You can learn more about James at his site, jamesbrumley.com, or follow him on Twitter, at @jbrumley.