It was anything but a high-conviction win, but stocks managed to hold onto a piece of Monday’s gain. The S&P 500 ended the day up 0.09%, just barely able to hang on to its place above a pivotal support level.

Facebook (NASDAQ:FB) did a great deal of the heavy lifting, rallying more than 4% on the heels of news that it was planning to launch its own cryptocurrency. Chesapeake Energy (NYSE:CHK) wasn’t far behind though, gaining more than 3% thanks to rebounding natural gas prices, which hit multi-month lows just a few days back. A multi-week selloff from CHK set the stage rather nicely though.
Advanced Micro Devices (NASDAQ:AMD) led the losers, off almost 4% after Goldman Sachs posted some broadly bearish thoughts on software names. AMD was guilty by indirect association though, and is teetering on its worst losing streak in eight months.
Headed into Tuesday’s trading action though, it’s the stock charts of McKesson (NYSE:MCK), Gilead Sciences (NASDAQ:GILD) and Dish Network (NASDAQ:DISH
) that are worth the closest looks. Here’s why, and what’s likely to happen next.
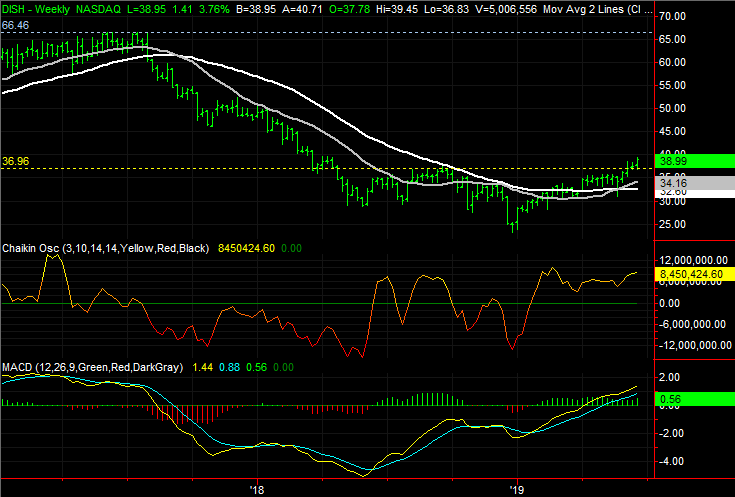
Dish Network (DISH)
On Tuesday of last week we pointed out Dish Network was putting the finishing touches on a move above a significant technical ceiling. But, the nature of the effort was less than convincing. It was going to require a confirmation of sorts that DISH shares were ready to remain above that resistance.
We moved toward that goal over the course of last week, but yesterday we effectively sealed the deal. The shape and placement of Monday’s bar says the bulls mean business. Now that the heavy lifting is done the stock has a lot of room to continue recovering its 2017 and 2018 losses.
Click to Enlarge
- The ceiling in question is right around $36.90, plotted in yellow on both stock charts. That was a resistance level in late May, but as the weekly chart shows, it was a huge problem in mid-2018.
- Monday’s bar is ideal. A decent open only had to kiss the former technical ceiling to drive the stock to its highest close in over a year.
- Bolstering the bullish argument is how much volume took shape behind yesterday’s gain. But, this also wasn’t the first time we’ve seen a volume surge behind major forward progress. The bulls are starting to form, en masse.
- The weekly chart puts it all in perspective. There’s not another major technical ceiling in sight until the $66.50 area, marked in blue.
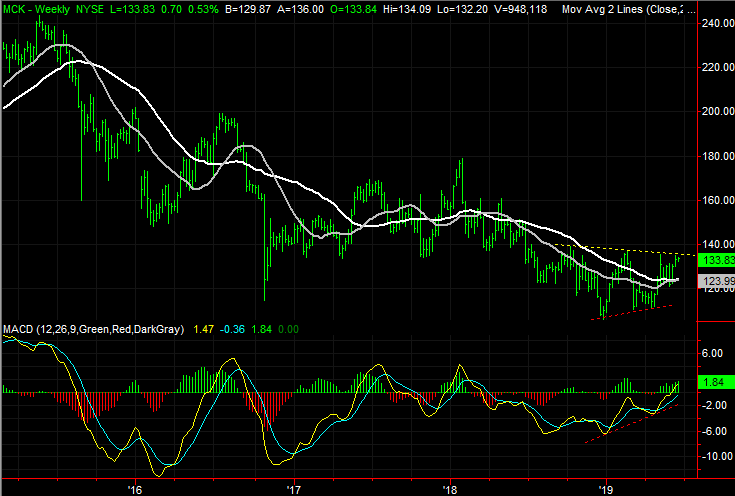
McKesson (MCK)
A little over a week ago McKesson was featured as a budding breakout candidate. It has crossed back above all of its key moving average lines, and though a rather important technical ceiling remained above, the momentum was encouraging.
That resistance line ended up being tested as expected, although MCK shares failed to clear it. They’re still in the hunt for that breakout move though, and now they’re even closer to starting it with an ideal bull signal.
Click to Enlarge
- The resistance level to watch is the line that traces all the major peaks going back to October, including last week’s. It’s plotted in yellow on both stock charts.
- It’s evident on both charts, but the weekly chart puts the current converging wedge pattern in perspective. This is one of the best chances we’ve seen of reversing a multi-year selloff.
- Although the last one didn’t offer much help, the purple 50-day moving average line is about to cross above the white 200-day line. That will draw a crowd of bulls no matter what, but especially if McKesson can break above its falling resistance line.
Gilead Sciences (GILD)
Take it with a grain of salt, as we’ve seen it before, to no avail. But, Gilead Sciences shares are knocking on the door of a key break above a well-established resistance line. Although there’s another major ceiling beyond that one that could disrupt the chart that’s admittedly easy to disrupt, there’s also a chance that the bears have inflicted enough damage and that the company itself has finally addressed the drug-cost issues that have proven so problematic for the stock’s price.
- Like McKesson, Gilead shares have been range-bound for several weeks after a two-year spell. It’s one reasonably compelling way to end weakness and kick off some progress.
- Just above the resistance currently at $67.15 is the 200-day moving average line at $68.14, plotted in white on both stock charts. That line is still a make-or-break level. The key will be making that move at a sustainable pace.
- The weekly chart not only serves as a reminder that huge swings in both directions are possible, but that last year’s peak around $79 could be where any breakout move finally comes to a close.
As of this writing, James Brumley did not hold a position in any of the aforementioned securities. You can learn more about James at his site, jamesbrumley.com, or follow him on Twitter, at @jbrumley.