The bulls were roaring as the week’s opening bell rang, but they weren’t quite in the same bullish mood at the end of the session. What was at one point almost a 1.1% gain for the S&P 500 was pared back to a less impressive 0.47% advance, leaving the recovery effort in question.

Advanced Micro Devices (NASDAQ:AMD) did its part to keep the broad market propped up, gaining 2.5% on news that the next generation of Xbox gaming consoles from Microsoft (NASDAQ:MSFT) would use AMD hardware.
Holding the market back was United Technologies (NYSE:UTX), off more than 3% following word that it would be acquiring Raytheon (NYSE:RTN) to make a compelling aerospace and defense name, but it will also be an organization that will inherit Raytheon’s pension woes.
None make for great trading prospects headed into Tuesday’s session, however. Rather, it’s the stock charts of Norfolk Southern (NYSE:NSC), Dish Network (NASDAQ:DISH) and Synchrony Financial (NYSE:SYF
) that merit the closer looks. Here’s why.
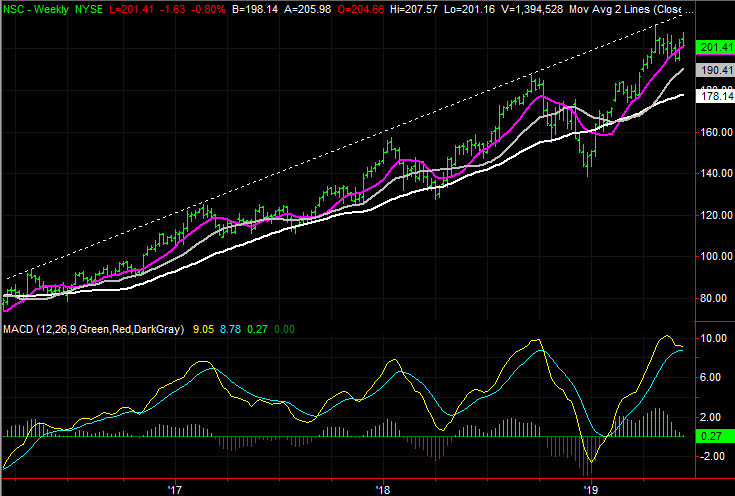
Norfolk Southern (NSC)
In late April we cautioned that Norfolk Southern shares had served up all the telltale signs that the rally had run its course. Not only had a long-term ceiling finally been bumped into, the doji-shaped bar from April 24 suggested the transition from a net-buying to a net-selling environment had been made.
The progress did end up stopping there, though selling never started. While the bears growled a couple of times, NSC has been content to just move sideways in the meantime. Given some of the red flags that have started to wave within the past couple of weeks.
Click to Enlarge
- The chief red flag is the way selling volume has started to swell since the later part of May.
- We’re also nearing a bearish MACD crossunder on the weekly chart. Those tend to be good, long-lived sell signals.
- While the risk of a selloff remains, as long as Norfolk Southern remains above the recently developed support around $193.80, the possibility is a moot point.
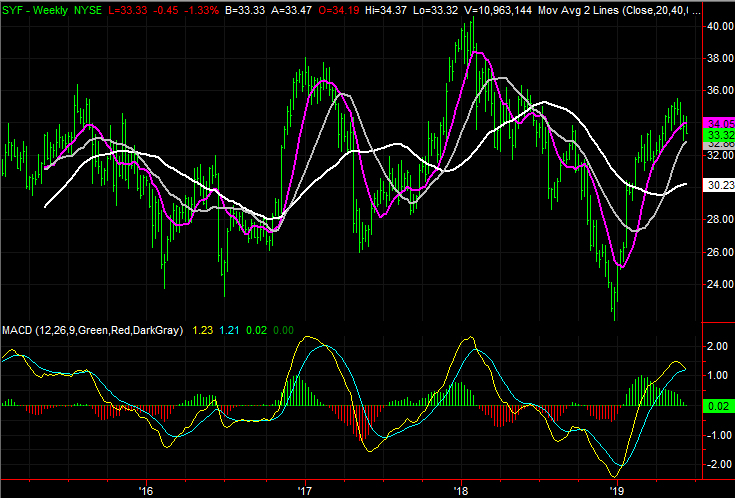
Synchrony Financial (SYF)
Synchrony Financial is no stranger to major moves, both up and down. There’s no rhyme or reason to its rises and falls though. Rather, when the market decides to turn it around, it does so. It does so, however, with the usual clues of a turn.
It just dished out a bearish round of those clues, plus some new ones to boot. One of the bigger ones took shape just yesterday, almost cementing the budding pullback into place. One more tough day could do the trick.
Click to Enlarge
- The first of the clues is Monday’s slide back below the purple 50-day moving average line, after a failure to move back above the blue 20-day moving average.
- There’s also a subtle hint in the volume trend for the past few days. Although shares rallied in the middle of last week, the buying volume faded the whole time. Now back on the way down selling volume is growing again. There are more bears than bulls out there.
- Zooming out to the weekly chart it’s clear how close the stock is to a bearish MACD crossunder, though the same chart also shows a transition from bullish momentum to budding bearish momentum.
Dish Network (DISH)
Finally, it has almost certainly got more to do with the fact that AT&T (NYSE:T) is mulling the sale of its DirecTV brand to it than with any newfound bullishness about the company. But, the way Dish Network has moved of late compared to its recent history is still technically relevant, and bullish.
- A couple of weeks ago, DISH popped above resistance at $35.56, plotted in blue, and as of this week, DISH shares are above a more meaningful technical ceiling around $36.90, plotted in yellow on both stock charts.
- The weekly chart not only shows how big of a deal the ceiling around $36.90 is — it’s a move to a new 52-week high — but how much room there is to recovery the bulk of what was lost in 2017 and 2018.
- It’s still not a clean breakout move, however. The bulk of Monday’s intraday was given back, and odds are good DISH Network will be back below $36.90 sooner or later. It’s the next move back above $36.90 that should get more prolonged traction.
As of this writing, James Brumley did not hold a position in any of the aforementioned securities. You can learn more about James at his site, jamesbrumley.com, or follow him on Twitter, at @jbrumley.