It was back and forth all day yesterday, and when all was said and done, the tug-of-war essentially ended in a tie. The S&P 500 lost 0.03% of its value on Tuesday, squelching the rally effort for a day, but at least keeping the market positioned for another try that doesn’t have to start with a lot of groundwork.

Advanced Micro Devices (NASDAQ:AMD) did more than its fair share of damage, falling 2.5% mostly following worries that its newest graphics cards may be priced too high. Sprint (NYSE:S) actually lost more ground though, off nearly 6% in response to news that several states were suing to block its intended merger with rival T-Mobile US (NASDAQ:TMUS).
There were some big winners all the same though. Chief among them was the 6.7% gain metal company Vale (NYSE:VALE) logged, mostly as a bounce back from news that it would be spending nearly $2 billion to shutter nine dams in Brazil where the company has suffered from multiple fatal dam breaks.
None are particularly compelling prospects as we move into Wednesday’s trading, however. Rather, pay close attention to the stock charts of Under Armour (NYSE:UA), General Electric (NYSE:GE) and
Ventas (NYSE:VTR). Here’s what’s most noteworthy for each.
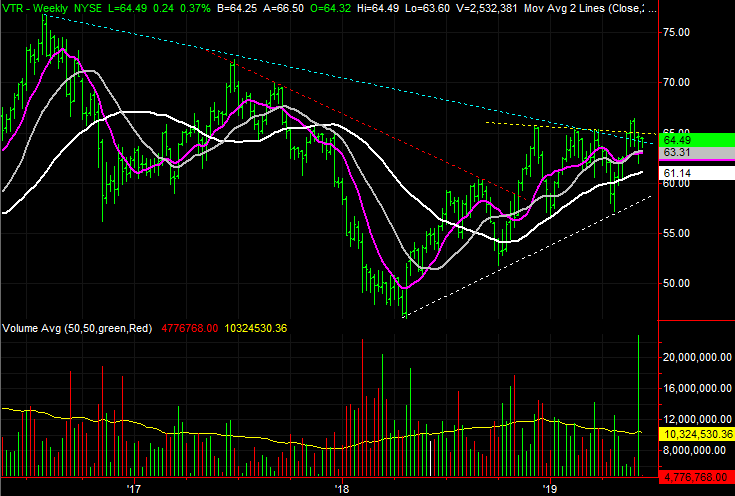
Ventas (VTR)
The last time we looked at Ventas back in November, it had just popped above a nagging resistance line, which put it en route to higher highs. And, that’s what happened. VTR poked above resistance around $58.40, and by December, it was trading around $65.50. That’s when VTR shares bumped into another set of resistance lines.
Those ceilings are still a problem. But, they’re also now just part of a much bigger consolidation effort that’s about to come to an end. A huge converging wedge shape is nearing its point, and Ventas has already knocked one of them over. The last big one is in reach.
Click to Enlarge
- The final line in the sand is plotted in yellow on both stock charts. Although VTR shares poked above that ceiling once last month, it has otherwise been the big resistance level.
- Zooming out to the daily chart you can see several different support and resistance lines, each of which puts the stock in a successively bullish position.
Under Armour (UA)
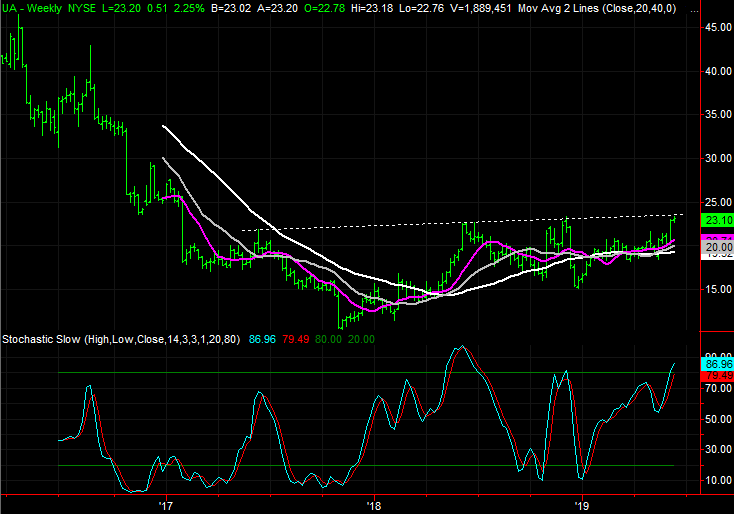
Under Armour has tried three times since April of last year to get back in a bullish groove. The first two times failed, and the third one is now underway. Given its history and the fact that the stock is once again overbought, odds are good this third time won’t be the charm either. However, the fact that UA shares continue to take swings suggests it’s only a matter of time before the effort finds success. Best of all, it’s crystal clear where Under Armour shares will slide out of its rut and into a prolonged uptrend.
Click to Enlarge
- The big resistance line to watch is currently near $23.50, marked with a white dashed line on both stock charts. That ceiling tags all the major peaks since last year, including the one from Monday.
- Zooming out to the weekly timeframe, we can see what happens when the stochastic lines move into overbought condition like we are now. The bulls may find more success at a slower pace, though they’ll need to peel back from here either way to make that happen.
- The weekly chart also clarifies how much room there is to recover the big selloff from 2016, once the effort gets moving at a sustainable pace.
General Electric (GE)
All of the rebound efforts General Electric shares have made since the beginning of the year have proven fruitless, making the current one suspect. Indeed, most would-be buyers have lost interest in GE, and aren’t even aware that the once-struggling company’s shares are even toying with a true rebound.
Yet, now’s precisely the time investors need to put General Electric back on their radars, and watchlists. Although not over the last of its key hurdles yet, it quietly moved above one big one, and is within sight of the final one. It’s not the ideal effort thus far, but there’s still a whole lot working in favor the recovery move.
- It’s evident on the daily chart, but only fully appreciable on the weekly chart … the moving average lines that have been diverging since the beginning of 2017 are converging again. It’s a major clue of transition.
- As of Tuesday, GE shares are back above the 200-day moving average line, plotted in white on both stock charts.
- Although the weekly chart shows us the Chaikin line is back above zero, the daily chart makes it clear that there’s not much volume behind the recovery effort so far.
- The make-or-break level is right around $10.50, plotted in yellow on both stock charts, where the stock has peaked a couple of different times since March.
As of this writing, James Brumley did not hold a position in any of the aforementioned securities. You can learn more about James at his site, jamesbrumley.com, or follow him on Twitter, at @jbrumley.