Another win for the market on Thursday, with the S&P 500 ending the session up 0.23% to finish the session at just a hair below 3,000. The volume grew once again on the third-straight daily gain, though it is still below average.

CVS Health (NYSE:CVS) and UnitedHealth Group (NYSE:UNH) ranked among the session’s biggest winners, up 4.7% and 5.5%, respectively, after President Trump decided to not enact new rules that would stymie rebates on pharmaceutical purchases. At the other end of the spectrum, Merck (NYSE:MRK) led the losers on Thursday, as the President’s move worried some that it could end up being pharmaceutical companies that bore the brunt of any cost-control initiatives. Merck shares ended the day down by 4.5%.
Headed into the final trading day of the week, though, it’s HollyFrontier (NYSE:HFC), Activision Blizzard (NASDAQ:ATVI) and Vertex Pharmaceuticals (NASDAQ:VRTX) that merit the closest looks from traders. Here’s why, and what to look for.
Vertex Pharmaceuticals (VRTX)
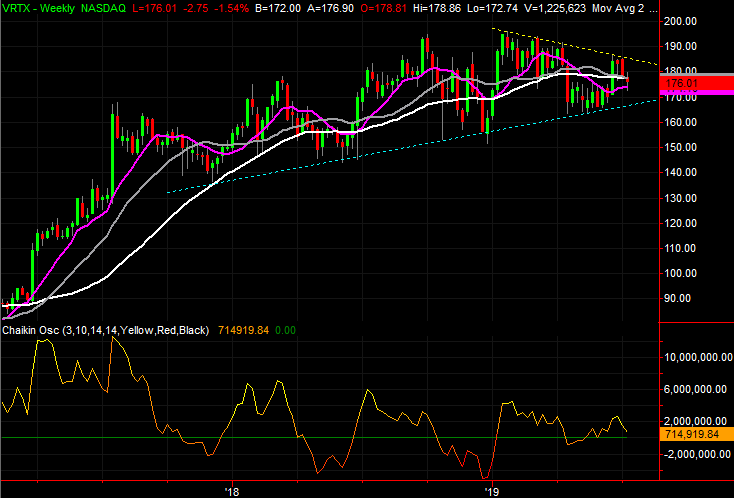
Vertex Pharmaceuticals is still technically in a long-term uptrend, guided higher by a rising support line that extends all the way back to late-2017. Although it has ebbed and flowed along the way, it has made higher highs and higher lows for some time now.
The flavor of the advance changed in a fundamental way this year, however, and although it has been more erratic than not, current and prospective owners may want to note that the repeated bearish swings are taking a cumulative toll on the broad uptrend.
Click to Enlarge
- Chief among the changes in the timbre of the major rally is the fact that for the first time in several quarters, VRTX has logged a streak of lower highs. They’re plotted in yellow on both stock charts.
- The long-term support line is marked with a dashed blue line on both charts.
- It’s easy to look past in the wide swings we’ve seen since the beginning of 2018, but the most recent round of weakness has pulled the purple 50-day moving average line below the white 200-day line for the first time since mid-2018 (although that instance proved to be a great entry point).
HollyFrontier (HFC)
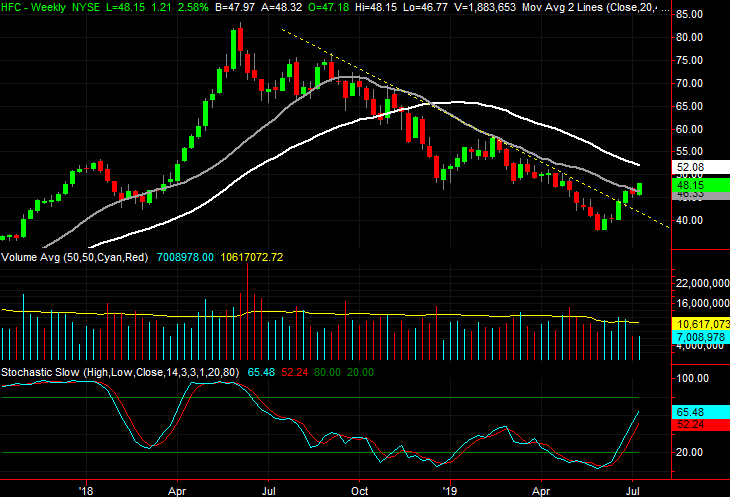
Late last month, HollyFrontier shares were able to punch through a long-standing falling resistance line, and proceed to test their 100-day moving average line, marked in gray on both stock charts. That test ultimately failed, sending HFC lower again. Shares only needed to take a small step back before renewing a much-needed running start. The second effort made a big dent on Thursday.
Click to Enlarge
- The resistance line in question is marked in yellow on both stock charts. In retrospect, May’s steep selloff served as the capitulation the chart needed.
- Although it faltered the first time when attempting to push past the moving average line (highlighted), Thursday’s second attempt worked nicely.
- While the volume behind the runup since May’s bottom is on reasonably healthy volume, the pace hasn’t been healthy. HollyFrontier isn’t yet stochastically overbought, but it’s getting to that point fast.
Activision Blizzard (ATVI)
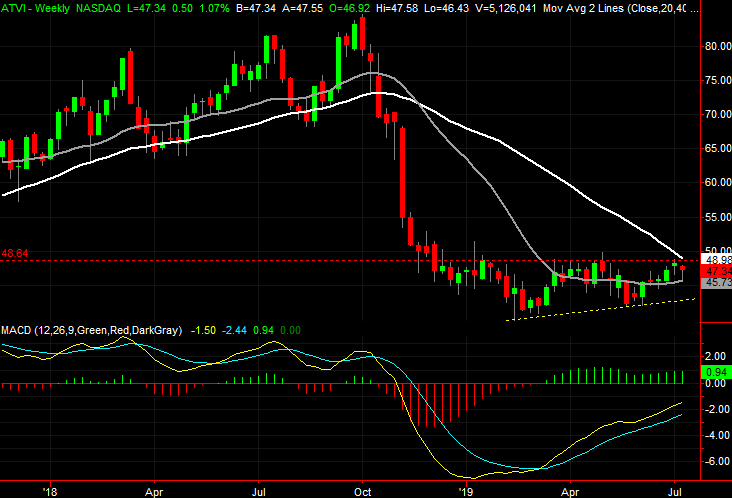
Finally, within nothing more than a quick glance, Activision Blizzard shares merely look stuck in a trading range. And, that may well be the case. A deeper look at some of the more subtle clues, however, suggests the bulls may be working on a bigger-picture recovery of last year’s oversized pullback. The inflection point is within sight too, with a massive amount of room to run if and when the last hurdle area is cleared.
Click to Enlarge
- The subtle hints are not just the bullish crosses of most of the moving average lines on the daily chart. Since the end of last month, the 20-, 50- and 100-day moving average lines are acting as support.
- The inflection point, or final potential resistance, is the 200-day moving average line at $51, plotted in white on both stock charts. In the meantime, there’s horizontal resistance around $48.80.
- The weekly chart puts the potential rebound in perspective. It also better identifies the fact that we’ve already seen a higher low.
As of this writing, James Brumley did not hold a position in any of the aforementioned securities. You can learn more about him at his website jamesbrumley.com, or follow him on Twitter, at @jbrumley.