The market started to follow through on Thursday’s rebound effort, opening higher on Friday. When push came to shove as the closing bell for the week approached, however, traders panicked again. The S&P 500’s loss of 0.62% left it at 2976.61 … the lowest close in nearly two weeks.

Advanced Micro Devices (NASDAQ:AMD) did the most net damage, losing 1.5% of its value, with investors taking Mizuho’s profit-taking advice to heart. Snapchat parent Snap (NYSE:SNAP) logged the most noteworthy loss on Friday though, falling 3.6% as investors hesitate heading into its earnings report this week. The 170% rally since its late-2018 low suggests confidence, but leaves the stock subject to profit-taking no matter what its quarterly report looks like.
At the other end of the spectrum, Boeing (NYSE:BA) flew 4.5% higher after the company announced plans to take a $4.9 billion charge related to its 737 debacle. Although bad news on the surface, the market may have been pricing in worse.
As the new week’s trading action gets started though, none of those names are top trading prospects. Rather, it’s the stock charts of Southern Co. (NYSE:SO), PepsiCo (NASDAQ:PEP) and Fastenal
(NASDAQ:FAST) that merit the closest looks.
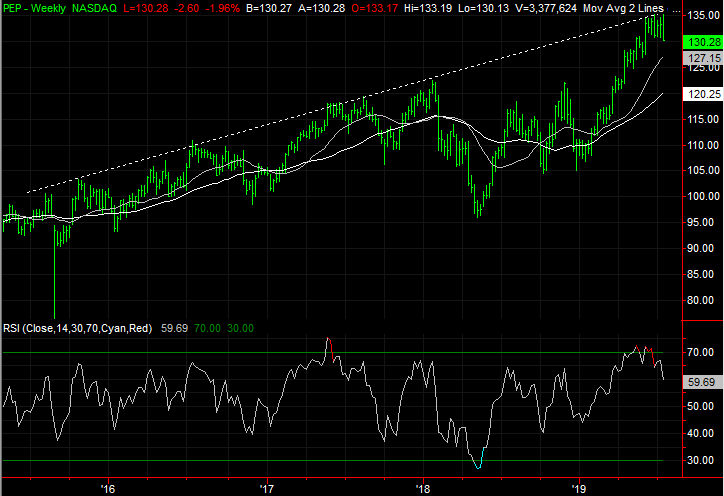
PepsiCo (PEP)
A week and a half ago PepsiCo was put under the microscope, as it was putting pressure on what was quickly taking shape as an important support level. That floor ended up stopping the weakness before it got started. That recovery effort, however, faltered just as quickly when a familiar ceiling was revisited. Friday’s tumble was the one that broke PEP stock out of that rut, for the worst. In fact, two key technical floors were shattered, opening the door to what could be a sizable selloff.
The floor in question is, or was, $130.59, marked in yellow. PepsiCo was held up there a couple of times since late June. Friday’s close failed to find support there.
Click to Enlarge
Fastenal (FAST)
With nothing more than a passing glance, it would be easy to chalk up the recent weakness from Fastenal to market-driven bearishness. And, perhaps that’s all it is. Fastenal is inching dangerously close to a more significant breakdown though, and one more misstep could open the selling floodgates.

Click to Enlarge
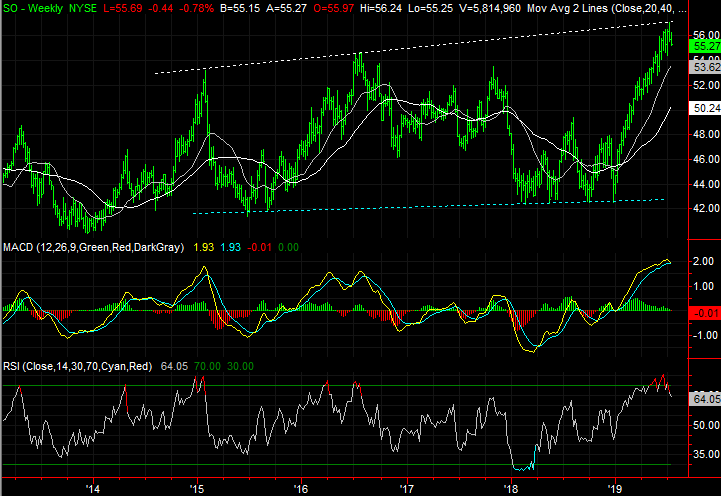
Southern Co. (SO)
Southern Co. didn’t end last week on a particularly high note. The stock fell 1.5% on Friday, peeling back on above average volume. Nevertheless, the bigger trend remains a bullish one. The support line that has been steering SO shares upward since February remains intact, and Southern Co. stock remains above its pivotal moving average, plotted in pink on the daily chart.
The flavor and support for the rally is changing though, for the worst. It took a bump into a familiar resistance line to get the ball rolling, but SO is now in more trouble than it may seem to be on the surface.
Click to Enlarge
- The problematic ceiling is plotted in white on the weekly chart, though it has been made more problematic by the fact that it was bumped when the RSI indicator also reached an overbought condition.
- Friday’s bearish volume was above average, but not just more than the norm. It was the most daily distribution we’ve seen since April, hinting there are many would-be profit takers waiting in the wings.
- While the deck may be stacked against Southern Co. shares here, the pivotal line is the purple 50-day moving average line currently at $54.95.
As of this writing, James Brumley held a long position in Boeing. You can learn more about James at his site, jamesbrumley.com, or follow him on Twitter, at @jbrumley.