Although down for the better part of the day, stocks managed to fight their way back into the black on Monday. The S&P 500’s 0.02% rise is anything but impressive, but it gives the bulls another day to build their technical and psychological support.

Symantec (NASDAQ:SYMC) held the rally back more than any other name, falling more than 10% after Broadcom (NASDAQ:AVGO) announced it was throwing in the towel in its acquisition effort. Teva Pharmaceutical (NYSE:TEVA) was problematic too, however, falling nearly 8% after Morgan Stanley downgraded the stock. Analyst David Risinger is worried about underestimated competition and litigation risks related to its opioid business.
At the other end of the spectrum, Tesla (NASDAQ:TSLA) jumped more than 3% for a bevy of reasons, including winning two different “car of the year” awards.
As Tuesday’s action gets going, however, it’s the stock charts of Ford (NYSE:F), International Paper (NYSE:IP) and LyondellBasell Industries
(NYSE:LYB) that merit the most attention. Here’s why.
International Paper (IP)
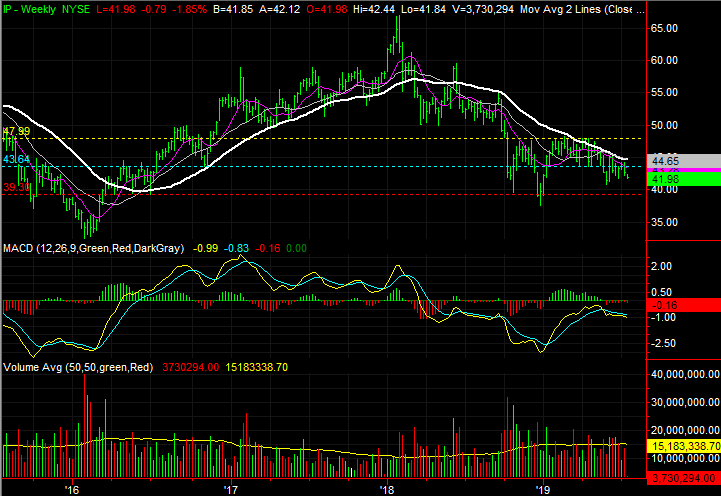
The last time we looked at International Paper back in mid May, it was trapped in a downtrend largely guided by resistance at the 200-day moving average line, plotted in white on both stock charts. A near-term technical floor was holding it, but the sellers were persistently chipping away.
They ultimately won the fight, dragging shares below that support area. The stock tried to bounce back, as it has since early 2018. As has also been the case since then, however, IP once again lost a fight when another ceiling stepped up to the plate. Things are apt to get worse before they get better.
Click to Enlarge
- The newest technical ceiling is the 50-day moving average line, plotted in purple. Rebound efforts repelled there in early June and again in early July.
- This month’s weakness has also been on above-average selling volume, suggesting there are more bears waiting in the wings.
- The next major technical floor is around $39.50, marked in red. International Paper shares have found a floor there a few times since the beginning of 2016, and late last year in particular.
LyondellBasell Industries (LYB)
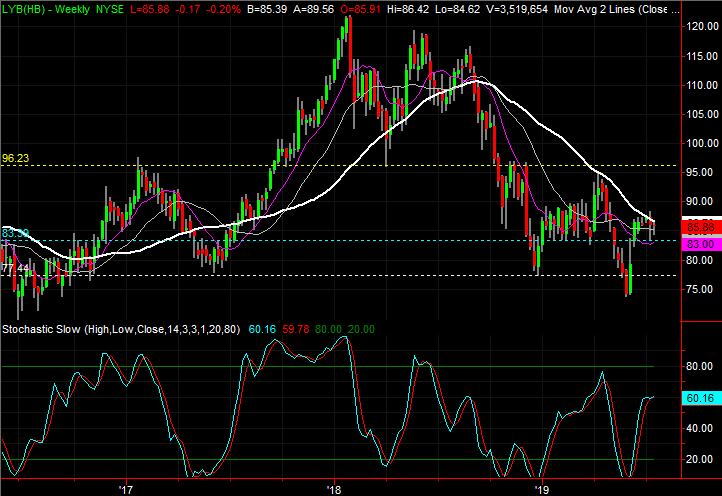
Two weeks ago, LyondellBasell Industries shares appeared to be on the mend. They had snapped back from a rough May, crawling back above the purple 50-day moving average line and then the gray 100-day average line, and then started to find support at that moving average. However, a push up and off the 100-day line to test the white 200-day moving average line ultimately proved disastrous. All it took was a kiss of the 200-day moving average to lead into a significant loss for that day.
Before sliding back into trouble though, LYB stock found support at an established floor again, and appears to be positioning for another shot at clearing the 200-day moving average. It’s less than an ideal effort though.
Click to Enlarge
- The support area in play now is once again the 50-day moving average line, bolstered by horizontal support around $83.60 where shares found a floor a few times in the first quarter of the year.
- Although the bleeding stopped before too much damage was done, the recent setback has been on huge volume, and the two rebound days were on subpar volume.
- If LyondellBasell can punch through the ceiling near $88, the next most meaningful level is around $96, marked in yellow, where LYB stock found support and resistance several times since 2017.
Ford Motor Company (F)
Ford has been a tough name to own for a long time. Even with the recent rebound effort, the stock remains down more than 40% from its 2014 peak price.
This effort could be different though. While we’ve seen past recovery effort falter when bumping into an established technical ceiling, reinforcing that very ceiling, this advance is better grounded than most of the past ones have been.

Click to Enlarge
- The ceiling in question is the resistance line that tags all the key peaks going back to 2015, plotted in blue on the weekly chart. It has being tested again.
- Since early June, F stock has found pretty persistent support at its purple 50-day moving average line. This support is highlighted on the daily chart.
- Although it wouldn’t readily appear this is the case on the daily chart, the weekly chart’s Chaikin line — by virtue of pointing upward again after crossing zero in April — says there’s consistent buying volume in place.
As of this writing, James Brumley held a long position in Ford. You can learn more about James at his site, jamesbrumley.com, or follow him on Twitter, at @jbrumley.