It took them a little while to believe it. But, after assessing what the minutes from the most recent Federal Reserve governors meeting said, investors decided the glass was half full. The S&P 500 ended Wednesday’s action at 2924.43, up 0.82%, and in the middle of several moving average lines.

Target (NYSE:TGT), incredibly enough, led the charge, rallying more than 20% on the heels of an impressive second-quarter report. Same-store sales grew 3.4%, and e-commerce revenue was up 34%. That’s a tremendous win for the retailer, which got a slow start on the digital sales front.
Nordstrom (NYSE:JWN) knocked it out of the park too, rallying more than 5% in front of its post-close report, then adding more than 10% in response to its solid quarterly earnings figure. Although sales came up short of expectations, income of 90 cents per share easily topped expectations of only 77 cents.
Not every name was a winner, though. Holding the market back more than most others was Cree (NASDAQ:CREE), and its 16% stumble. Although the chipmaker topped last quarter’s sales and profit expectations, investors were horrified of its guidance for the quarter now underway.
As Thursday’s action gets going, however, it’s the stock charts of News Corp (NASDAQ:NWSA), Bank of America (NYSE:BAC) and
Philip Morris International (NYSE:PM) that are of the most interest.
Philip Morris International (PM)
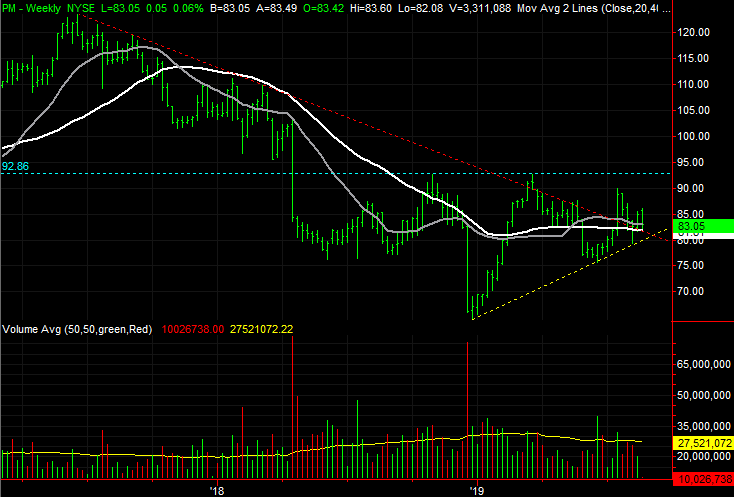
A year ago, Philip Morris International was in real trouble. PM stock was not only trending lower, it plunged April and wasn’t acting as if there was any interest in a recovery. Even once the bulls started to test the waters by October, they had the rug pulled out from underneath them. In one fell swoop in December, Philip Morris was deep into new 52-week territory.
Things do seem to have taken a turn for the better in the meantime though. While it has been anything but a straight-line effort, the choppiness has also been net bullish. One more good ‘umph’ could push PM shares over the hump.
Click to Enlarge
• It doesn’t look like it on the daily chart, but it’s there. All the moving average lines, and the stock itself, are converging to a point that could be setting up an explosive divergence.
• Although the undertow is bullish, there’s still a significant ceiling ahead. As marked on the weekly chart, in blue, the $92.86 level has capped a couple of rally efforts since late last year.
News Corp (NWSA)
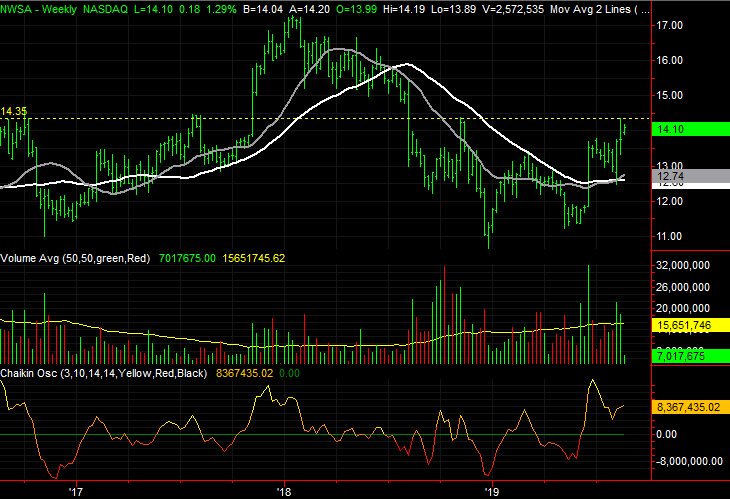
A week and a half ago, News Corp shares jumped higher, pivoting out of a lull at a point exactly where support would be expected to be found. The move rekindled a big gain in June that shook shares out of a rut and possibly back into an uptrend.
That move persisted for a couple more days, albeit at a slower pace, until finally a familiar technical ceiling stopped the effort cold. The subsequent pullback was quelled as well though, with the advance rekindled last week. Although the ceiling remains in place, the odds of punching through this effort improve every day.
Click to Enlarge
• The daily chart of News Corp also makes clear that the white 200-day moving average line and now the blue 20-day moving average line are serving as support, ending selloffs.
• As of yesterday, the gray 100-day moving average has moved above the 200-day line, and all four key moving average lines are sloped upward. The underlying momentum is undeniably bullish.
Bank of America (BAC)
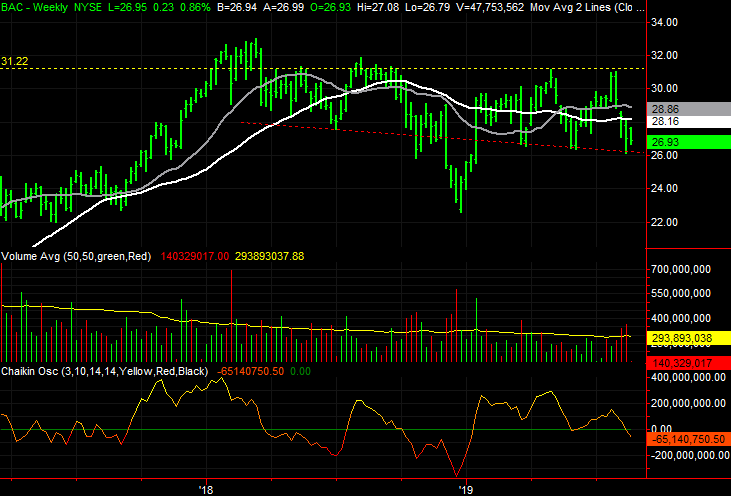
Banks like Bank of America aren’t in absolute dire straits, despite the recent rate cut. Though lower rates mean weaker profit margins on lending activity, the economy is reasonably healthy. Banks, including B of A, will be fine.
That doesn’t mean BAC stock is going to hold up against a near-term bear attack though. A well-established but sinking floor was met again last week, and though traders pushed up and off of it a little bit, it’s still within reach of a break below that floor. And, the backdrop is less than encouraging.
Click to Enlarge
• It has been messy on this front since the beginning of the year, we’re on the cusp of seeing shorter-term moving average lines slide below longer-term moving averages.
• It’s only evident on the weekly chart, but it’s crystal clear there … there’s growing volume behind the recent weakness. The Chaikin line has fallen below the zero level as of last week.
As of this writing, James Brumley did not hold a position in any of the aforementioned securities. You can learn more about him at his website jamesbrumley.com, or follow him on Twitter, at @jbrumley.