The market ended last week like it started it … on the wrong foot. Thanks to Friday’s 0.53% slide, the S&P 500 took a loss of 1.0% for the five-day stretch. It was the second weekly loss in a row, jibing with a calendar that says this should be a rough patch for stocks.

Micron Technology (NASDAQ:MU) did more than its fair share of the damage, losing more than 11% of its value on 2020 guidance that fell short of expectations. That setback also proved to be a drag on other key tech names like Advanced Micro Devices (NASDAQ:AMD), which fell 2.5% on Friday.
At the other end of the spectrum, long-beleaguered bank Wells Fargo (NYSE:WFC) finally caught something of a break, jumping nearly 4% on news that its new CEO would be a well-qualified and well-respected Charles Scharf.
As for tickers that are going to be worth a closer trading look headed into today’s action though, take a look at the stock charts of Amazon (NASDAQ:AMZN), Broadcom (NASDAQ:AVGO) and Intercontinental Exchange
(NYSE:ICE). Here’s why.
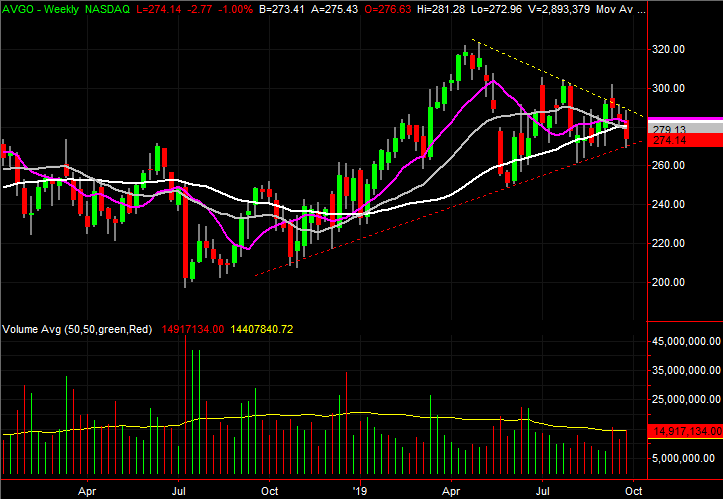
Broadcom (AVGO)
It has been caught up in the midst of political and trade warfare between China and the United States. But, the fact of the matter is, Broadcom and all of its tech peers has been doing just fine despite the tough headlines. The bears have quietly been chipping away, however, dragging AVGO stock to a make-or-break level that will either have to put up or shut up, so to speak.
Click to Enlarge
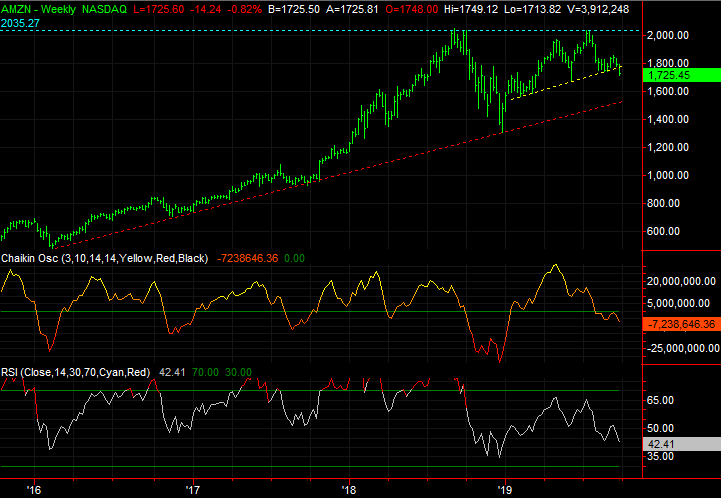
Amazon (AMZN)
It may be one of the market’s favorites, as well as one of the market’s best performers. But, that doesn’t mean Amazon.com is incapable of falling.
That’s especially true right now. Albeit sporadically, AMZN stock has slowly but surely been chipping away at some key technical floors. From here, as of Friday’s action, the onus is on the bulls to prove AMZN isn’t going to sink further. Perhaps worse, things are close to getting really, really bad.
Click to Enlarge
- The big red flag here is the move under the 200-day moving average line plotted in white. We’ve seen it before to no avail, but this time it happened at the same time Amazon shares broke under the yellow technical floor that extends back to February.
- Should this selloff continue, the worst-case scenario is a trip back to the $1450-ish area where support that connects all the key lows since 2016 is found. It’s marked as a red dashed line.
- Bolstering the bearish argument is the amount of bearish volume that has started to materialize since May. On the weekly chart, the Chaikin line’s cross below zero is quantified evidence of that undertow.
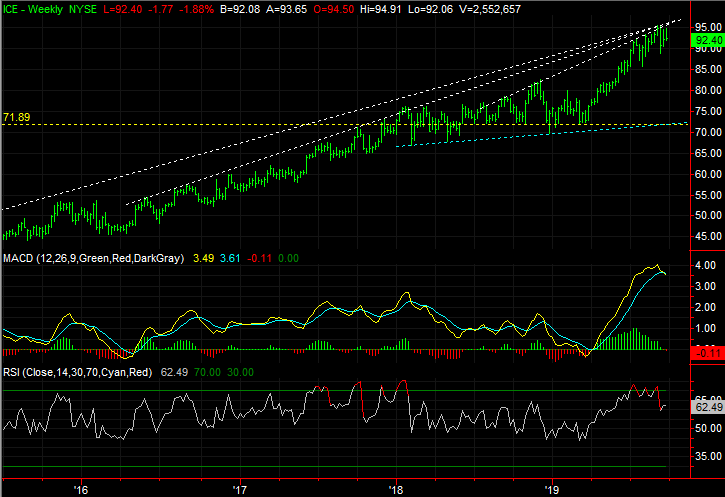
Intercontinental Exchange (ICE)
With nothing more than a quick glance at Intercontinental Exchange shares, it would be easy to chalk up Friday’s setback to marketwide weakness. And, maybe that’s all it is.
But, the shape and context of that weakness is telling, and troubling. A bigger-picture look at the stock charts of ICE readily makes clear that momentum has been slowing, and for good reason. It would be surprising if Intercontinental Exchange wasn’t at the onset of a sizeable selloff, given all the clues falling into place.
Click to Enlarge
As of this writing, James Brumley did not hold a position in any of the aforementioned securities. You can learn more about James at his site, jamesbrumley.com, or follow him on Twitter, at @jbrumley.