Investors changed their mind … again. After a horrendous Tuesday, hope for an amicable end to the tariff war being fought between China and the U.S. lifted the S&P 500 higher to the tune of 0.91%.

Roku (NASDAQ:ROKU) led the way, gaining more than 9%, and bouncing back from the prior day’s drubbing. Macquarie upgraded the streaming receiver maker, suggesting the stock could be worth three times its current value. Apple (NASDAQ:AAPL) made a much bigger overall impact though, with its 1.2% advance in response to Canaccord Genuity’s growing enthusiasm for iPhone 11 demand.
Holding the market back more than other names was Levi Strauss (NYSE:LEVI). Shares of the jeans company fell big-time for a second day in a row, with Wednesday’s 7.6% setback the result of more selling in response to a fiscal Q3 report that wasn’t that bad. Bank of America even says the stumble is a buying opportunity.
Headed into Thursday’s session though, none of those names are the top trading prospects. Rather, take a look at stock charts of Interpublic Group of Companies (NYSE:IPG), AES (NYSE:AES) and
Boston Scientific (NYSE:BSX). Here’s why.
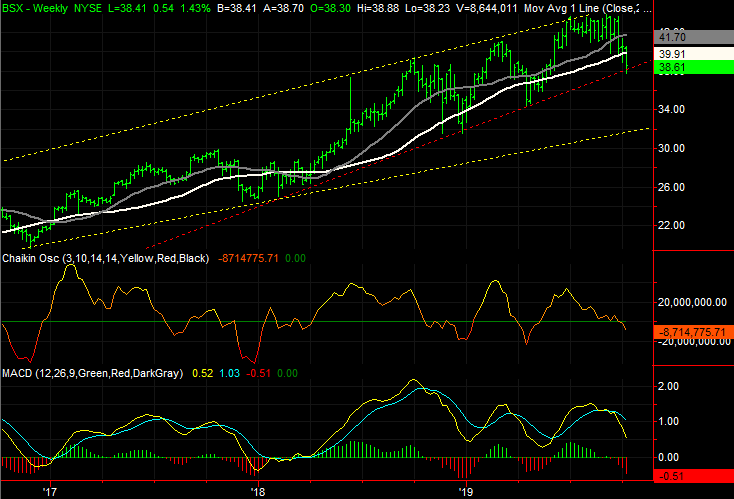
Boston Scientific (BSX)
When we last looked at Boston Scientific a month ago, shares were trapped in a near-term narrow trading range, but were also near the upper boundary of a long-term trading range.
The lower end of that short-term range, plotted with light blue lines on the daily chart, ended up failing as support. So did the 200-day moving average, marked in white on both stock charts. There’s still one last bastion of hope though, and it’s being tested right now.
Click to Enlarge
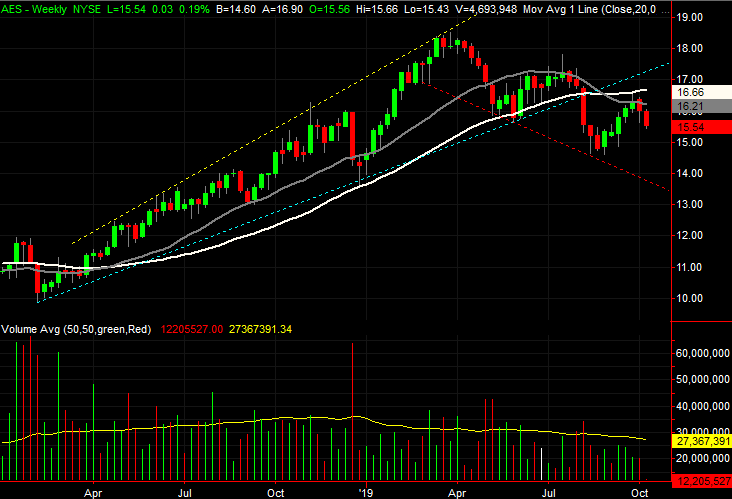
AES (AES)
Like most other oil and gas names, AES has been losing ground for the past several weeks. Unlike most other energy stocks though, this weakness is the result of unwinding a huge run-up last year that drifted into the first half of this year.
That pullback turned particularly interesting — and troubling — as of the end of last month. It got even more troubling again yesterday. The good news is, the most plausible downside target is crystal clear.
Click to Enlarge
Interpublic Group of Companies (IPG)
Finally, back in early Interpublic Group of Companies shares were knocking on the door of a key ceiling … the upper boundary of a well-established converging wedge, marked with light blue lines on both stock charts. Although the momentum was impressive at the time, it meant nothing until and unless IPG could clear that hurdle.
That never happened. In fact, by early August the stock had broken below the lower edge of the wedge shape. In the meantime, the bears have made an even stronger statement, renewing that weakness and pushing Interpublic Group of Companies shares to within striking distance of the next major technical floor.

Click to Enlarge
As of this writing, James Brumley did not hold a position in any of the aforementioned securities. You can learn more about him at his website jamesbrumley.com, or follow him on Twitter, at @jbrumley.